

Question: Looking at Model 5 from Table 2 in Sampson et al., which independent variables are significant predictors of violence, and in which direction? (e.g., males
- Looking at Model 5 from Table 2 in Sampson et al., which independent variables are significant predictors of violence, and in which direction? (e.g., "males have higher rates of violence than females") Be sure to list all the statistically significant variables (hint: count age and immigrant status as one variable each, and don't worry about the interaction terms - so you should have a list of 9 variables).
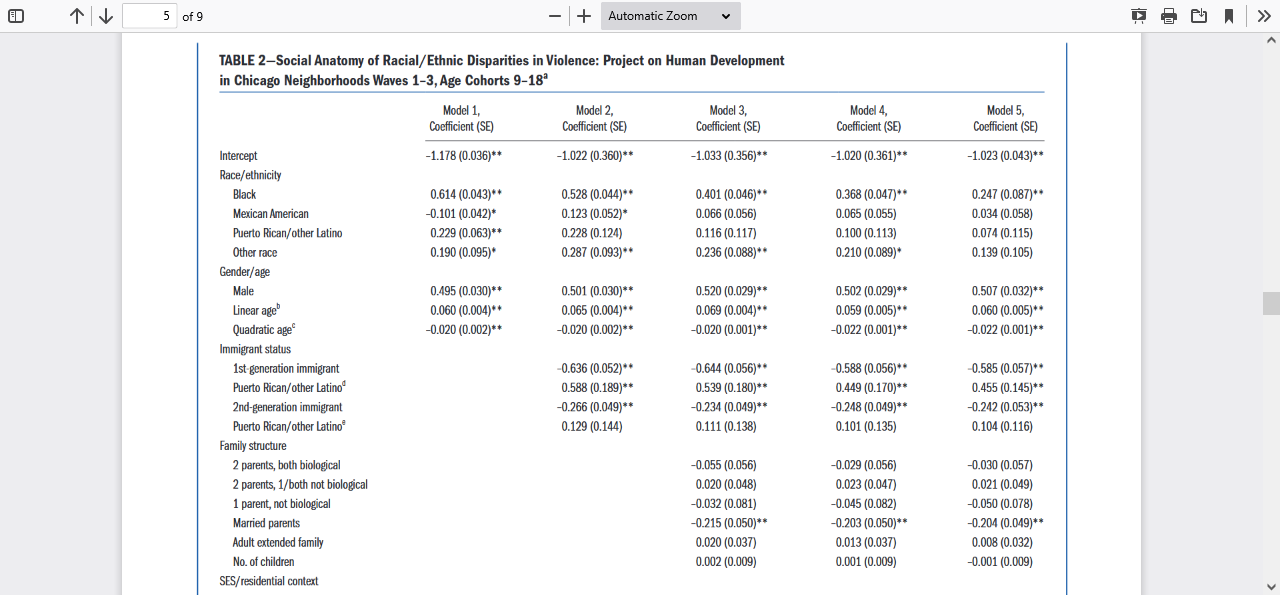
5 of 9 - + Automatic Zoom A > > TABLE 2-Social Anatomy of Racial/Ethnic Disparities in Violence: Project on Human Development in Chicago Neighborhoods Waves 1-3, Age Cohorts 9-18* Model 1, Model 2, Model 3, Model 4, Model 5 Coefficient (SE) Coefficient (SE) Coefficient (SE) Coefficient (SE) Coefficient (SE) Intercept -1.178 (0.036)** -1.022 (0.360)** -1.033 (0.356)** -1.020 (0.361)** -1.023 (0.043)** Race/ethnicity Black 0.614 (0.043)* * 0.528 (0.044)** 0.401 (0.046)+* 0.368 (0.047)* * 0.247 (0.087)* * Mexican American -0.101 (0.042)* 0.123 (0.052)* 0.066 (0.056) 0.065 (0.055) 0.034 (0.058) Puerto Rican/other Latino 0.229 (0.063)** 0.228 (0.124) 0.116 (0.117) 0.100 (0.113) 0.074 (0.115) Other race 0.190 (0.095)* 0.287 (0.093)** 0.236 (0.088)+* 0.210 (0.089)* 0.139 (0.105) Gender/age Male 0.495 (0.030)** 0.501 (0.030)** 0.520 (0.029)** 0.502 (0.029)** 0.507 (0.032)** Linear age 0.060 (0.004)*+ 0.065 (0.004)* * 0.069 (0.004)* * 0.059 (0.005)+* 0.060 (0.005)+* Quadratic age -0.020 (0.002)** -0.020 (0.002)** -0.020 (0.001)** -0.022 (0.001)** -0.022 (0.001)** Immigrant status 1st-generation immigrant -0.636 (0.052)** -0.644 (0.056)+* -0.588 (0.056)+* -0.585 (0.057)* * Puerto Rican/other Latino 0.588 (0.189)** 0.539 (0.180)** 0.449 (0.170)** 0.455 (0.145)** 2nd-generation immigrant -0.266 (0.049)** -0.234 (0.049)** -0.248 (0.049)** -0.242 (0.053)** Puerto Rican/other Latino 0.129 (0.144) 0.111 (0.138) 0.101 (0.135) 0.104 (0.116) Family structure 2 parents, both biological -0.055 (0.056) -0.029 (0.056) -0.030 (0.057) 2 parents, 1/both not biological 0.020 (0.048) 0.023 (0.047) 0.021 (0.049) 1 parent, not biological -0.032 (0.081) -0.045 (0.082) -0.050 (0.078) Married parents -0.215 (0.050)** -0.203 (0.050)** -0.204 (0.049)** Adult extended family 0.020 (0.037) 0.013 (0.037) 0.008 (0.032) No. of children 0.002 (0.009) 0.001 (0.009) -0.001 (0.009) SES/ residential context
Step by Step Solution
There are 3 Steps involved in it

Get step-by-step solutions from verified subject matter experts