

Question: Looking at tee below Identifying Forecasting Trends, one looks random, one looks like a trend, one looks cyclical, and one looks seasonal. Which is which?
Looking at tee below Identifying Forecasting Trends, one looks random, one looks like a trend, one looks cyclical, and one looks seasonal. Which is which? For which one of the four can you ignore the effects of time? Briefly explain
A)
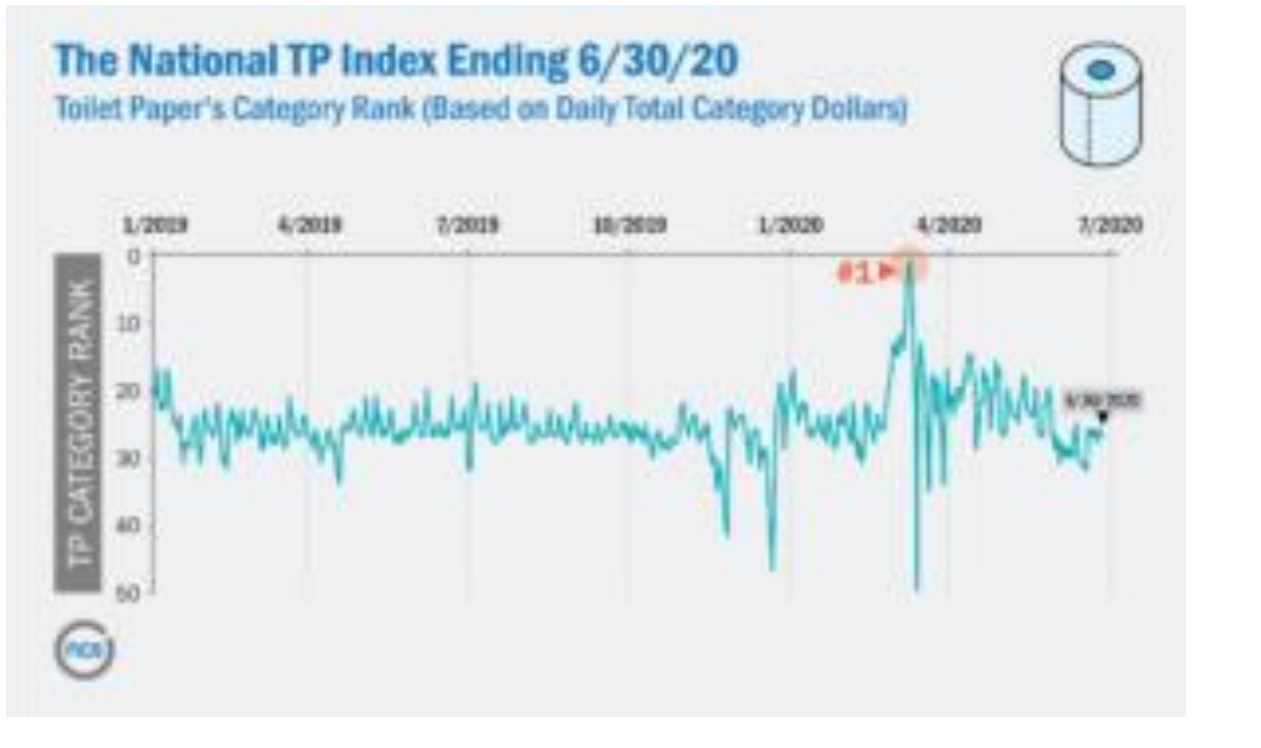
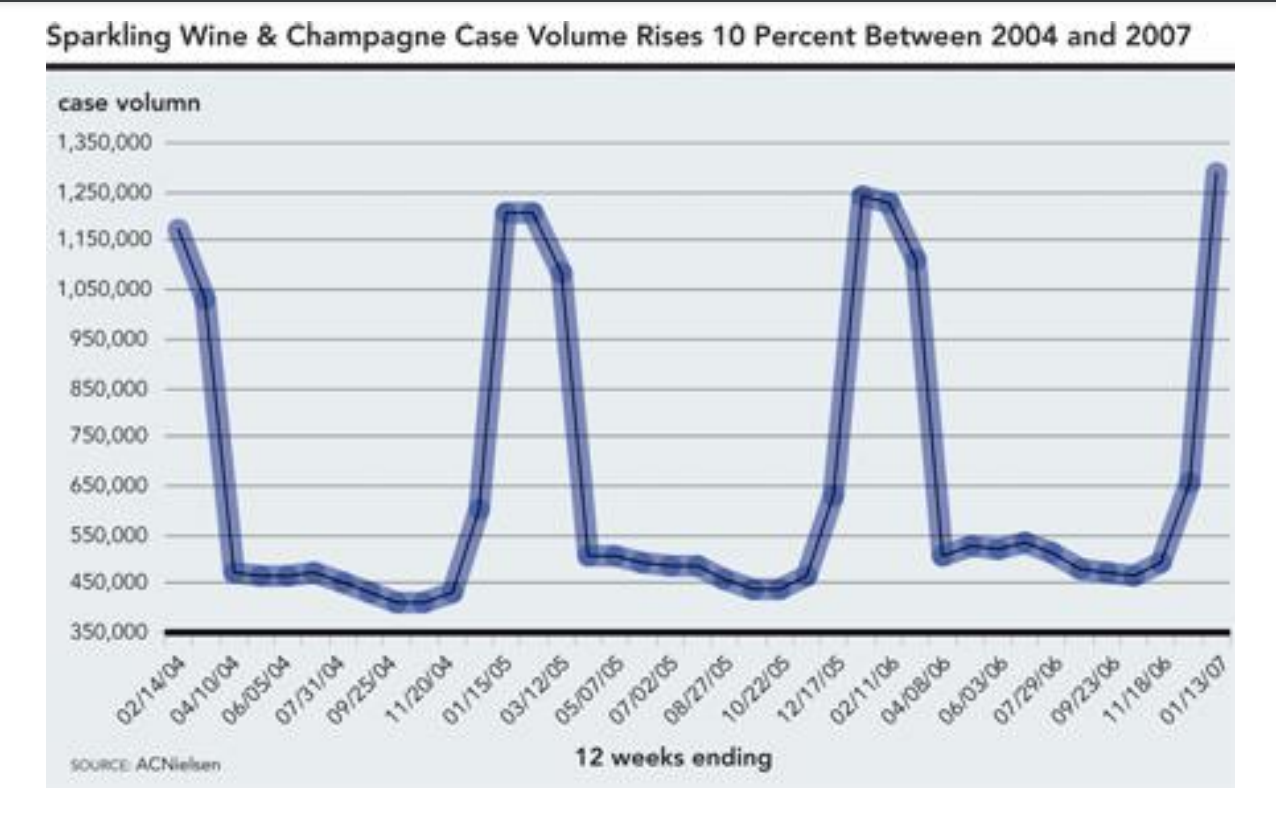
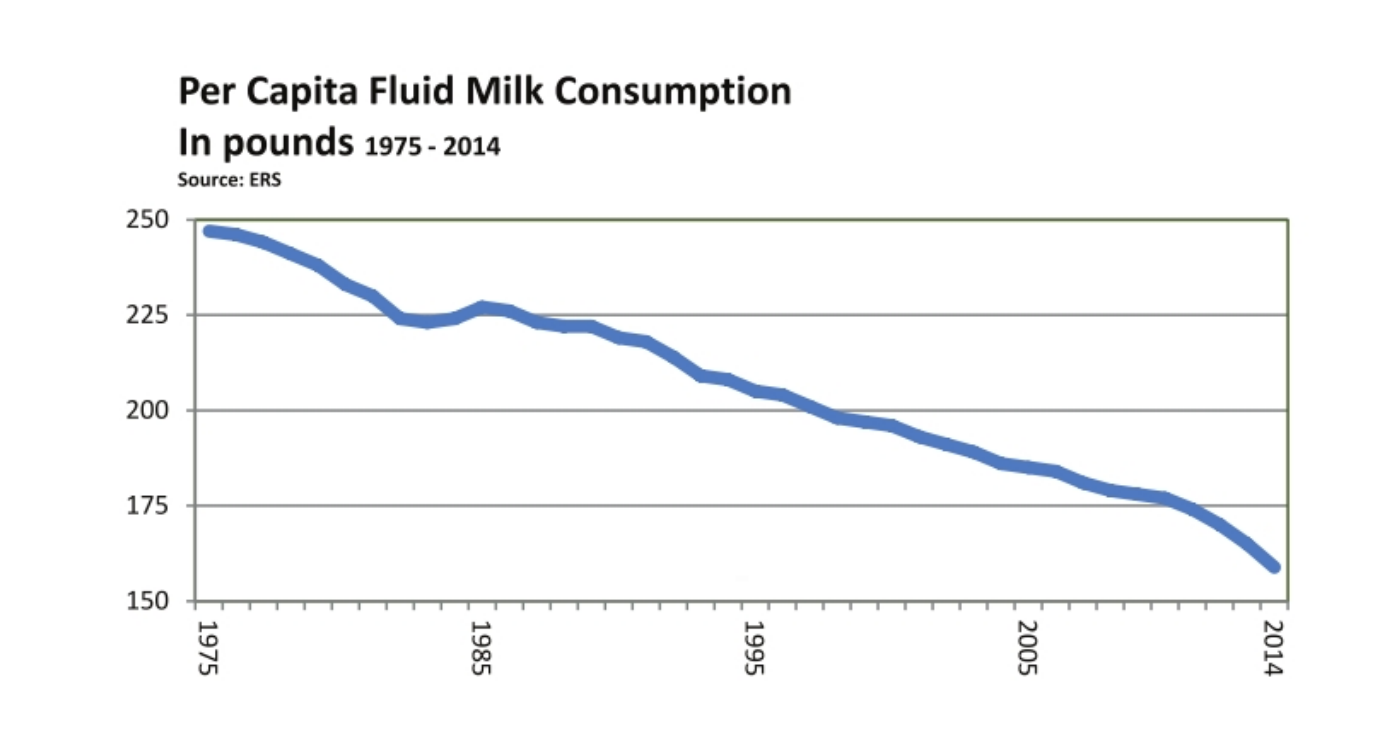
The National TP Index Ending 6/30/20 Toilet Paper's Category Rank (Based on Daily Total Category Dollars) 1/2029 4/2019 7/2019 1/2020 4/2120 20 TP CATEGORY RANK 30 40\fcase volumn 1,350,000 1,250,000 1,150,000 1,050,000 950,000 850,000 750,000 650,000 Sparkling Wine & Champagne Case Volume Rises 10 Percent Between 2004 and 2007 550.000 450,000 350,000 02/1 1/04 04/10/04 SOURCE ACNielsen 06/05/04 07/31/04 09/25/04 1/20 01/15/05 03/12 OS 05/07/05 07/02/05 08/27/05 12 weeks ending 10/2 yos 12/17 02/1 1/06 04/08/06 06/03/06 07/ 19106 09/23/08 11 /18 01/13 107Per Capita Fluid Milk Consumption In pounds 1975 - 2014 Source: ERS 250 225 200 175 150 1975 2014 2005 1995 1985
Step by Step Solution
There are 3 Steps involved in it

Get step-by-step solutions from verified subject matter experts