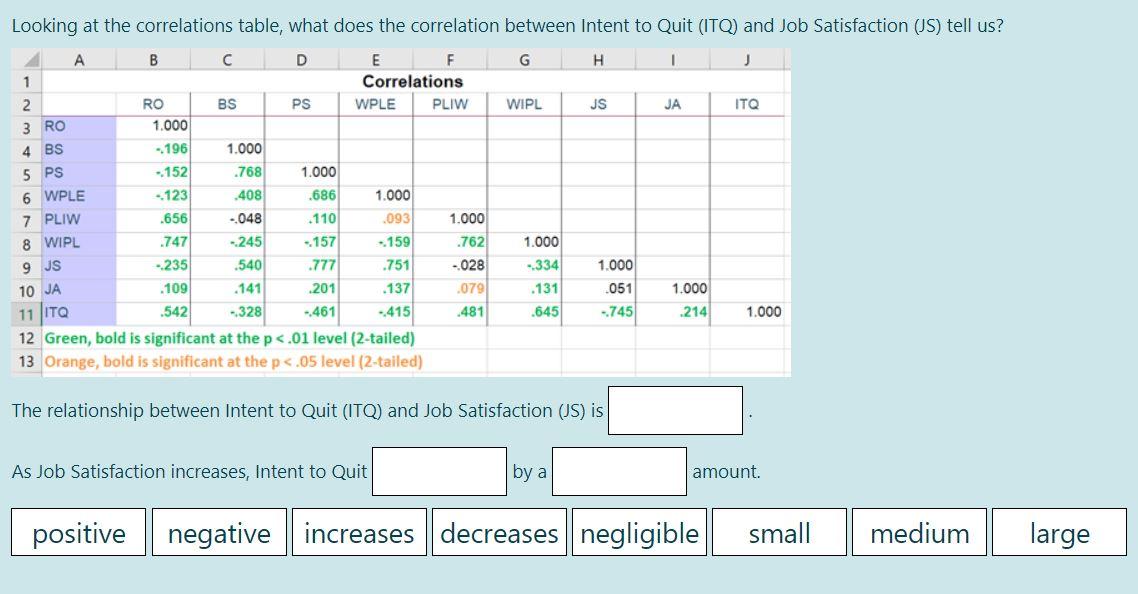
Question: Looking at the correlations table, what does the correlation between Intent to Quit (ITQ) and Job Satisfaction (JS) tell us? A B D E F

Looking at the correlations table, what does the

Looking at the correlations table, what does the correlation between Intent to Quit (ITQ) and Job Satisfaction (JS) tell us? A B D E F G H J 1 Correlations 2 RO BS PS WPLE PLIW WIPL JS JA ITQ 3 RO 1.000 4 BS - 196 1.000 5 PS - 152 .768 1.000 - 123 .408 .686 1.000 .656 ..048 .110 093 1.000 8 WIPL .747 -245 -157 - 159 1.000 9 JS - 235 .540 .777 .751 -334 1.000 10 JA .109 .141 201 .137 .079 .131 .051 1.000 11 ITA -328 -415 .645 - 745 .214 1.000 12 Green, bold is significant at the p <.01 level orange bold is significant at the p wple pliw .762 .542 .481 relationship between intent to quit and job satisfaction as increases by a amount. positive negative decreases negligible small medium large>

Step by Step Solution

There are 3 Steps involved in it

1 Expert Approved Answer
Step: 1 Unlock blur-text-image
Question Has Been Solved by an Expert!

Get step-by-step solutions from verified subject matter experts

Step: 2 Unlock
Step: 3 Unlock

Students Have Also Explored These Related General Management Questions!