

Question: Looking at the data, develop a correlation table and regression (either linear or multiple) for a variable?other than compa-ratio or salary?you feel might be important
Looking at the data, develop a correlation table and regression (either linear or multiple) for a variable?other than compa-ratio or salary?you feel might be important in answering our equal pay for equal work question. Interpret your results.
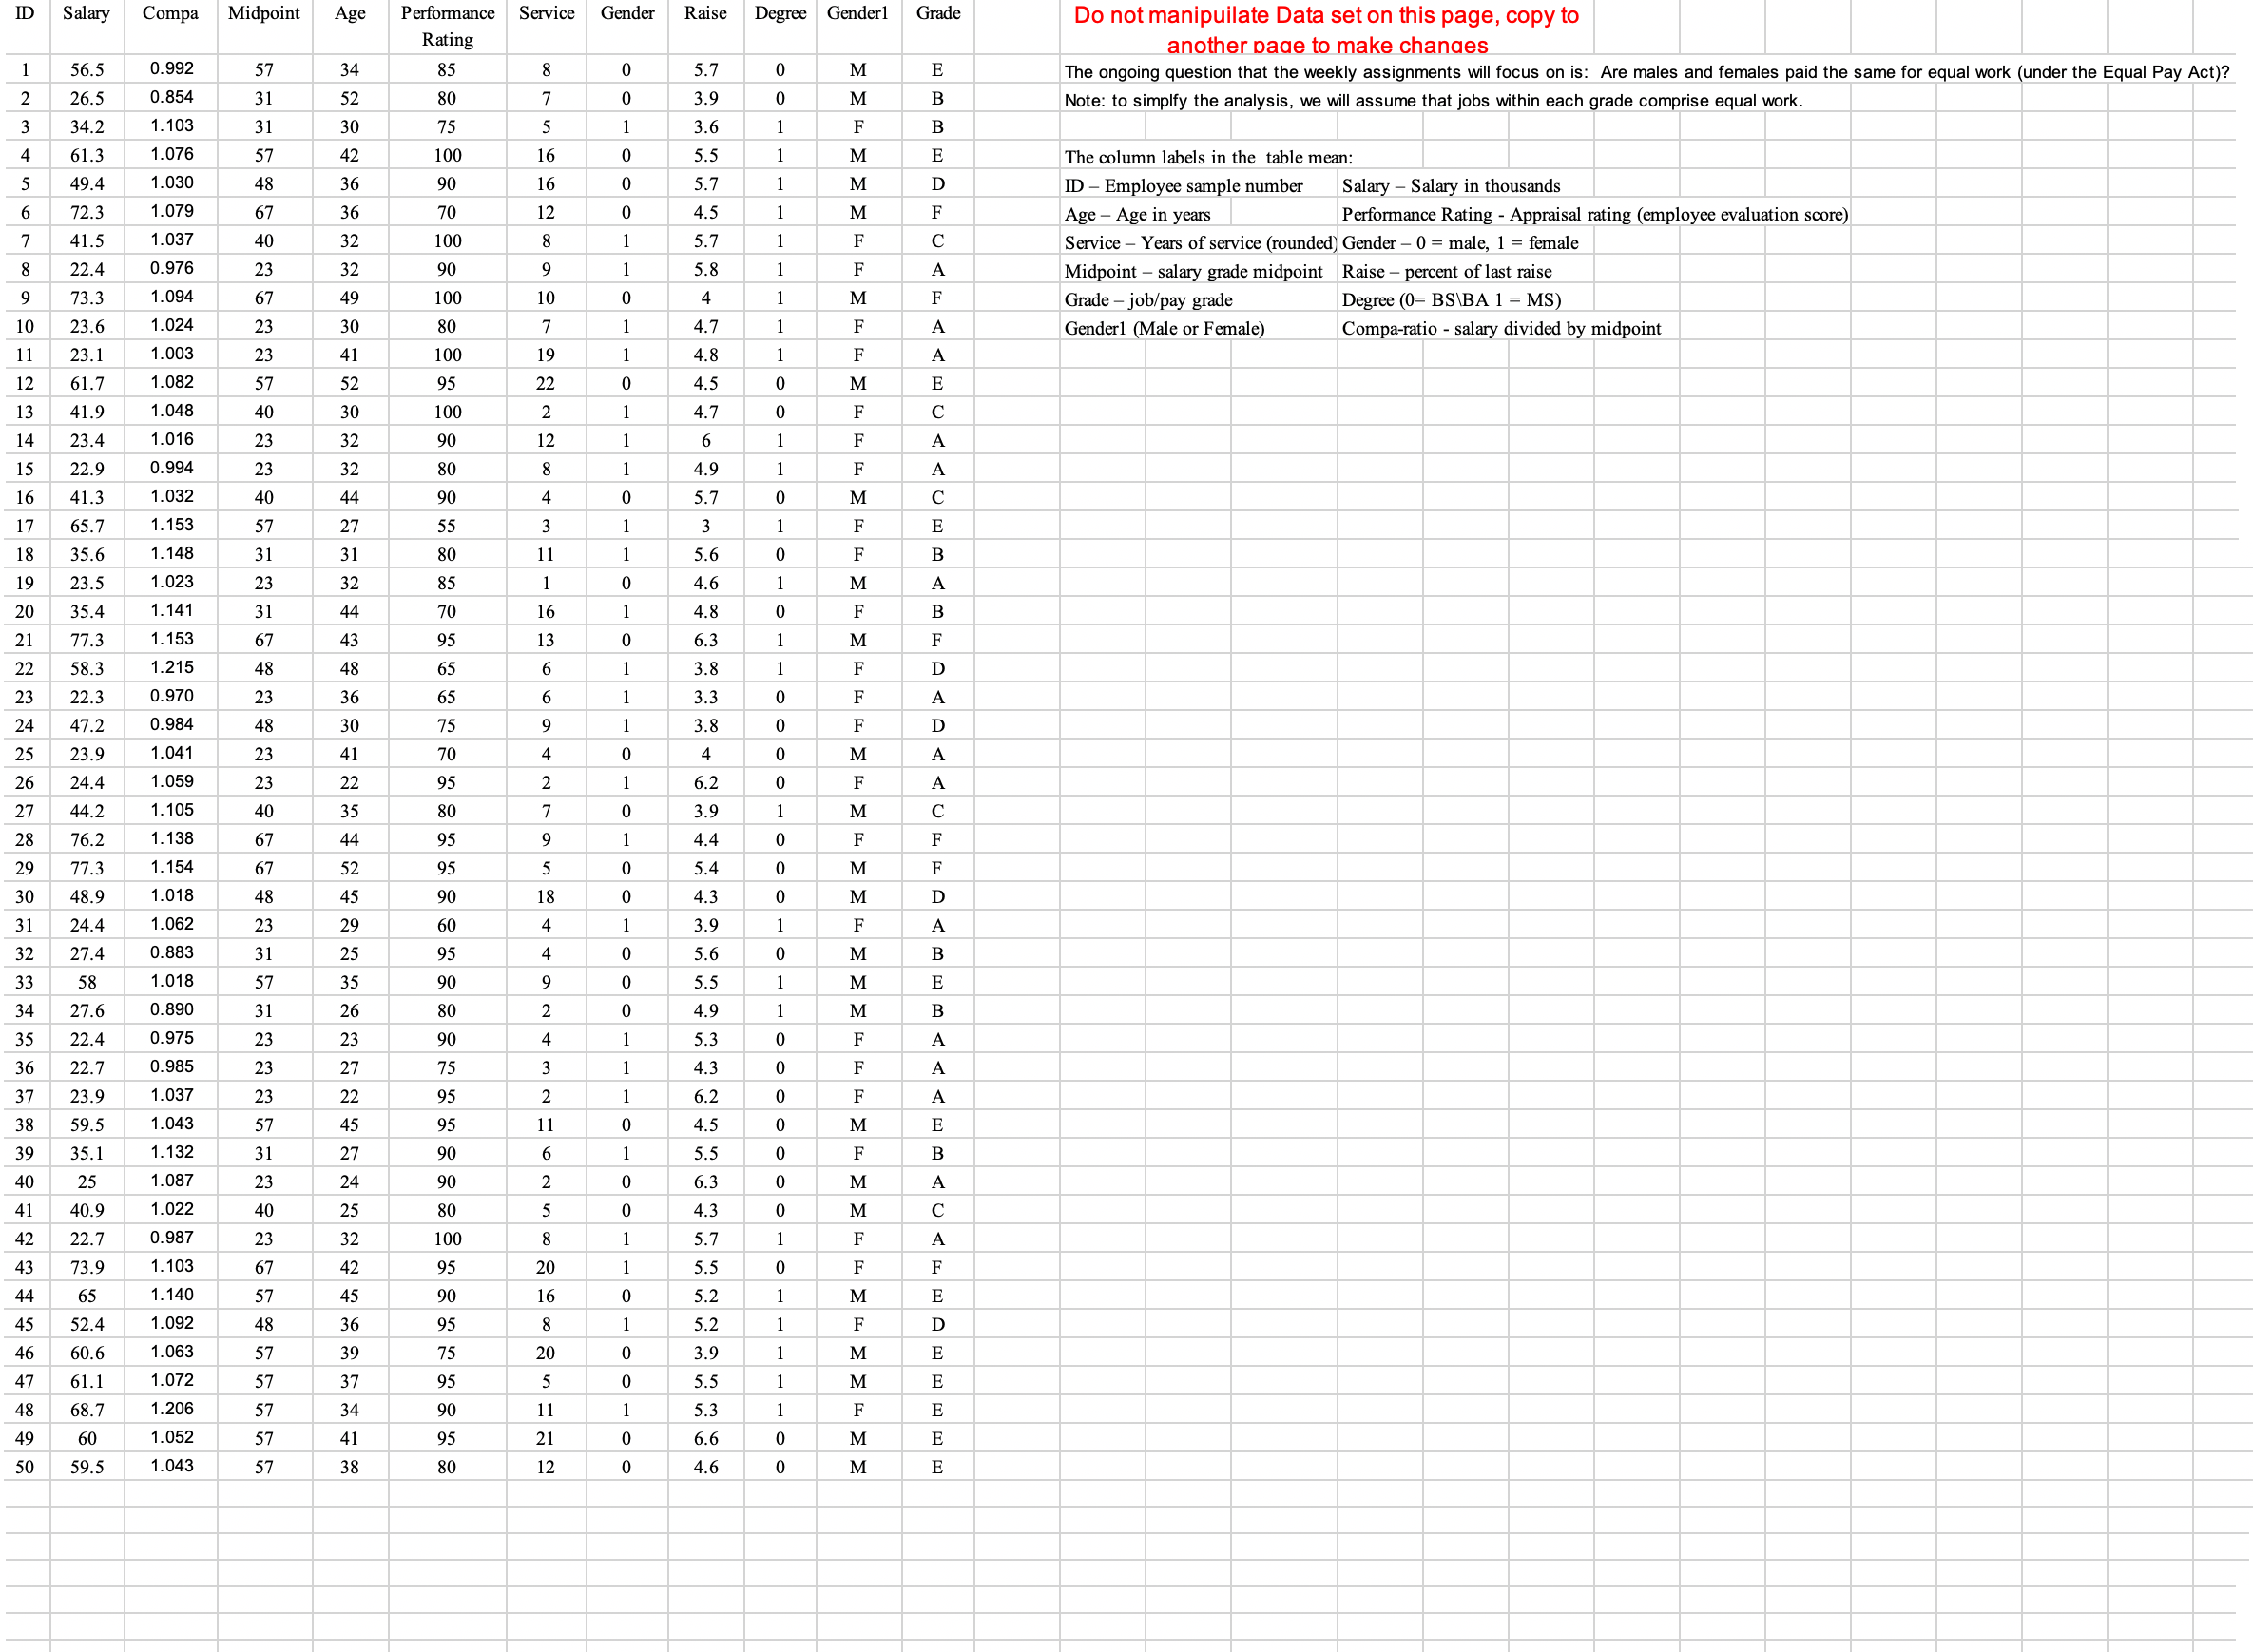
Do not manipuilate Data set on this page, copy to ID Compa Midpoint Age Performance Service Gender Raise Degree Genderl Grade Rating another page to make changes E The ongoing question that the weekly assignments will focus on is: Are males and females paid the same for equal work (under the Equal Pay Act)? M 56.5 0.992 34 85 8 0 5. 0 M Note: to simplfy the analysis, we will assume that jobs within each grade comprise equal work. 26.5 0.854 31 52 80 3.9 34.2 1.10 30 75 3.6 42 5.5 M 61.3 1.076 100 The column labels in the table mean: Salary - Salary in thousands 19.4 1.030 36 90 5.7 M D - Employee sample number 36 70 4.5 M Age - Age in years Performance Rating - Appraisal rating (employee evaluation score) 72.3 1.079 100 5.7 F C Service - Years of service (rounded) Gender - 0 = male, 1 = female 41.5 1.037 32 32 90 5 .8 F A Midpoint - salary grade midpoint Raise - percent of last raise 22.4 0.976 M Grade - job/pay grade Degree (0= BS\\BA 1 = MS) 73.3 1.094 49 100 A Gender1 (Male or Female) Compa-ratio - salary divided by midpoint 10 23.6 1.024 30 80 - - O 4.7 A 11 23.1 1.003 41 100 51. 1.082 52 95 E 41.9 1.048 30 100 14 23.4 1.016 22.9 0.994 16 41.3 1.032 17 65.7 1.153 27 18 35.6 1.148 23.5 1.023 20 35.4 1.141 44 77. 1.153 22 58.3 .21 48 23 22.3 0.970 36 47.2 0.984 30 23.9 1.041 24.4 1.059 22 14.2 1.105 35 SEE U S DO G SO UI N G E N W A N D A A DO U D J N A DAWG - EWAONNGGOOG 28 76.2 1.138 77.3 1.154 30 48.9 1.018 45 31 24.4 1.062 32 27.4 0.883 33 58 1.018 35 34 27.6 0.890 o O O - O O 35 22.4 0.975 36 22.7 0.985 27 37 23.9 1.037 38 59. 1.04 39 35.1 1.132 40 1.087 24 40.9 .02 22.7 0.987 73.9 1.103 .14 45 52.4 1.092 60. 1.063 61.1 1.072 O O - O - - O O - O 48 68 7 1.206 49 60 1.052 50 59 5 1.043
Step by Step Solution
There are 3 Steps involved in it

Get step-by-step solutions from verified subject matter experts