

Question: Looking at the directed dependency graph, The cost of making change to requirements is shown in the table Find the impact of making changes to
Looking at the directed dependency graph,
The cost of making change to requirements is shown in the table
Find the impact of making changes to each of the requirements R1 .. R10.
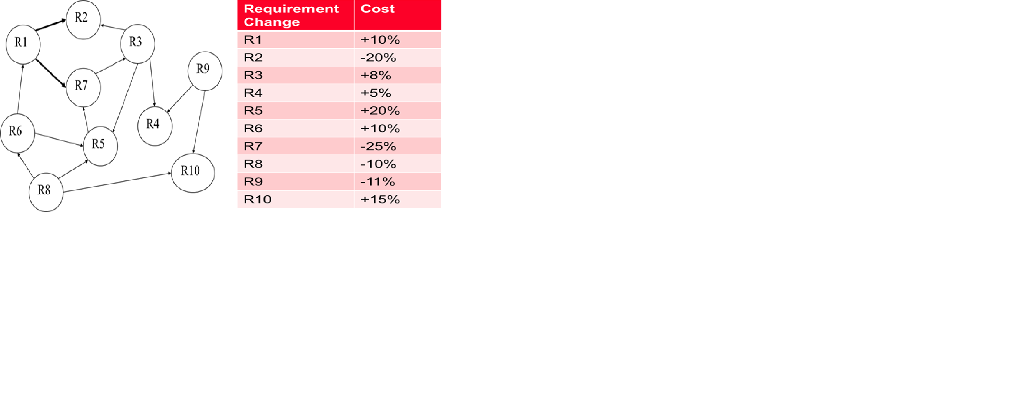
Cost Requirement Change R1 R2 R3 R4 R5 R4 R6 +10% -20% +8% +5% +20% +10% -25% -10% -11% +15% R10 R7 R8 R9 R10 Cost Requirement Change R1 R2 R3 R4 R5 R4 R6 +10% -20% +8% +5% +20% +10% -25% -10% -11% +15% R10 R7 R8 R9 R10
Step by Step Solution
There are 3 Steps involved in it
1 Expert Approved Answer
Step: 1 Unlock

Question Has Been Solved by an Expert!
Get step-by-step solutions from verified subject matter experts
Step: 2 Unlock
Step: 3 Unlock