

Question: looking at the graphs answer to these questions. - Data - comment on the sources, the reliability, and how representative they are. - Predictors -
looking at the graphs answer to these questions.
- Data - comment on the sources, the reliability, and how representative they are.
- Predictors - how are they similar and how are they different/complementary?
- Correlations - compare and interpret the different strengths.
- Regressions - compare and interpret the different slopes.
- Causation - identify possible lurking variables, hypothesize about causation.
1.
.
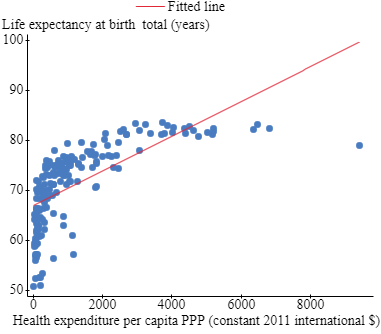
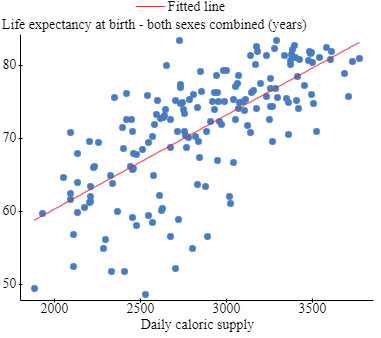
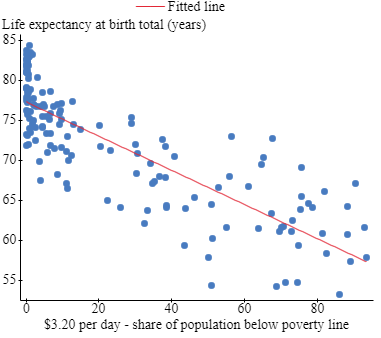
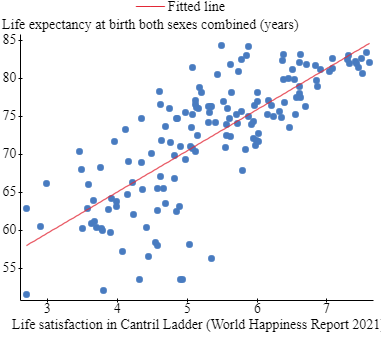
Fitted line Life expectancy at birth total (years) 100+ 90 d . 80+ 70- 60 50 2000 4000 6000 8000 Health expenditure per capita PPP (constant 2011 international $)Fitted line Life expectancy at birth - both sexes combined (years) 80 70- 60+ 2000 2500 3000 3500 Daily caloric supplyFitted line Life expectancy at birth total (years) 85+ 80 75 70- 65- 60 55 20 40 60 80 $3.20 per day - share of population below poverty lineFitted line Life expectancy at birth both sexes combined (years) 85+ 80 75- 70+ 65- 604 55 Life satisfaction in Cantril Ladder (World Happiness Report 2021
Step by Step Solution
There are 3 Steps involved in it

Get step-by-step solutions from verified subject matter experts