

Question: looking for some help with these excel formulas 2 The Hannah Company began operations in 2021. Its comparative income statements and balance sheets follow. Use
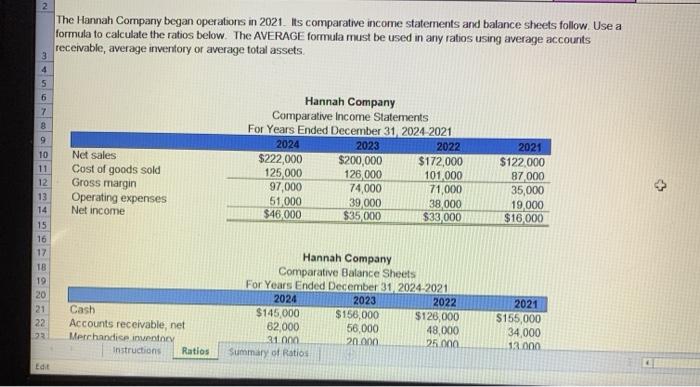
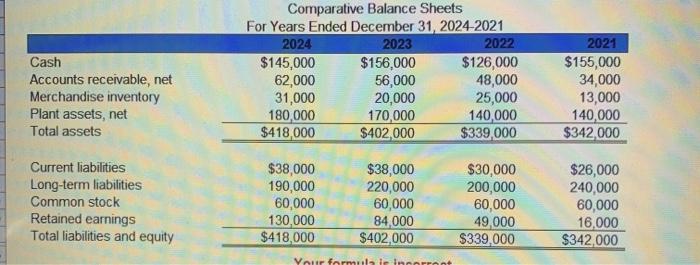
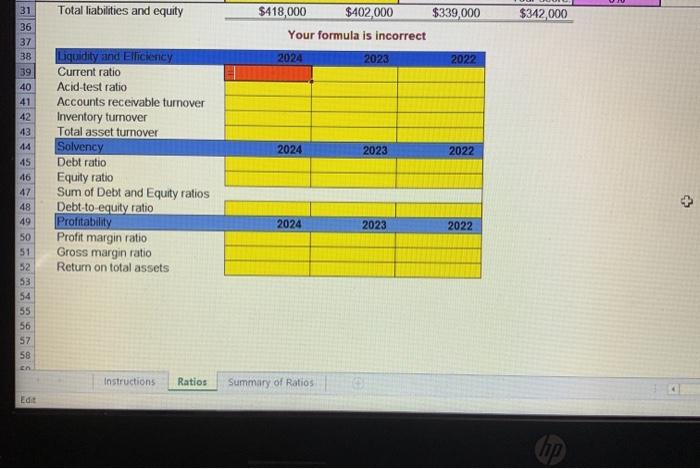
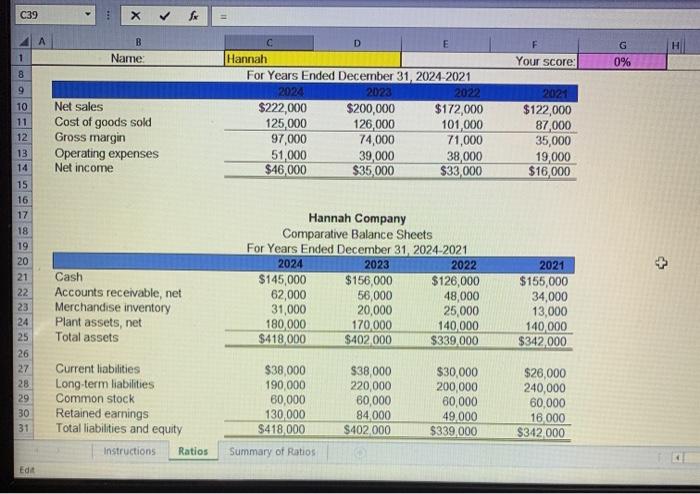
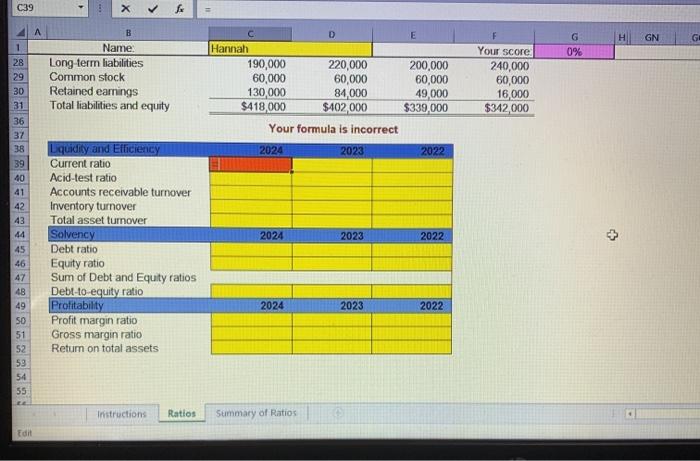
2 The Hannah Company began operations in 2021. Its comparative income statements and balance sheets follow. Use a formula to calculate the ratios below. The AVERAGE formula must be used in any ratios using average accounts receivable, average inventory or average total assets 3 4 S 6 7 8 9 10 11 12 13 Net sales Cost of goods sold Gross margin Operating expenses Net income Hannah Company Comparative Income Statements For Years Ended December 31, 2024 2021 2024 2023 2022 $222,000 $200,000 $172,000 125,000 126,000 101.000 97,000 74,000 71,000 51000 39000 38 000 $46,000 $35.000 $33,000 2021 $122.000 87 000 35,000 19000 $16.000 14 15 16 17 1B 19 20 21 22 Cash Accounts receivable, net Merchandise inventory Instructions Ratios Hannah Company Comparative Balance Sheets For Years Ended December 31, 2024-2021 2024 2023 2022 $145,000 $156,000 $126.000 82,000 56,000 48,000 31000 20.000 25.000 Summary of Ratios 2021 5155,000 34,000 13.000 Edit Cash Accounts receivable, net Merchandise inventory Plant assets, net Total assets Comparative Balance Sheets For Years Ended December 31, 2024 2021 2024 2023 2022 $145,000 $156,000 $126,000 62,000 56,000 48,000 31,000 20,000 25,000 180,000 170,000 140,000 $418,000 $402,000 $339,000 2021 $155,000 34,000 13,000 140,000 $342,000 Current liabilities Long-term liabilities Common stock Retained earnings Total liabilities and equity $38,000 190,000 60,000 130,000 $418,000 $38,000 220,000 60,000 84,000 $402,000 $30,000 200,000 60,000 49,000 $339,000 $26,000 240,000 60,000 16,000 $342.000 Vour formele le ant C39 D B Name: 1 Your score: G 0% 8 9 10 11 12 13 14 Net sales Cost of goods sold Gross margin Operating expenses Net income C Hannah For Years Ended December 31, 2024 2021 2024 2023 2022 $222,000 $200,000 $172,000 125,000 126,000 101,000 97,000 74,000 71,000 51,000 39,000 38,000 $46,000 $35,000 $33.000 2024 $122,000 87,000 35,000 19,000 $16,000 + 15 16 17 18 19 20 21 22 23 24 25 26 27 28 29 30 31 Cash Accounts receivable, net Merchandise inventory Plant assets, net Total assets Hannah Company Comparative Balance Sheets For Years Ended December 31, 2024 2021 2024 2023 2022 $145,000 $156,000 $126,000 62,000 56,000 48,000 31,000 20,000 25,000 180,000 170.000 140,000 $418.000 $402000 $339,000 2021 $155,000 34,000 13,000 140 000 $342.000 Current liabilities Long-term liabilities Common stock Retained earnings Total liabilities and equity Instructions Ratios $38,000 190,000 60,000 130,000 $418.000 Summary of Ratios $38,000 220,000 60,000 84.000 $402.000 $30,000 200,000 60,000 49.000 $339,000 $26,000 240,000 60,000 16 000 $342.000 Edit C39 A D H GN GE 1 G 0% B Name: Long-term liabilities Common stock Retained earnings Total liabilities and equity E Hannah 190,000 220,000 200,000 60,000 60,000 60,000 130,000 84,000 49,000 $418,000 $402,000 $339,000 Your formula is incorrect Your score 240,000 60,000 16,000 $342,000 28 29 30 31 36 37 38 39 40 2024 2023 2022 2024 2023 2022 41 42 43 44 45 46 47 48 49 SO 51 52 53 54 55 EE Liquidity and Efficiency Current ratio Acid-test ratio Accounts receivable turnover Inventory turnover Total asset turnover Solvency Debt ratio Equity ratio Sum of Debt and Equity ratios Debt-to equity ratio Profitability Profit margin ratio Gross margin ratio Return on total assets 2024 2023 2022 Instructions Ratios Summary of Ratios Edit
Step by Step Solution
There are 3 Steps involved in it

Get step-by-step solutions from verified subject matter experts