The accompanying summary data on CeO 2 particle sizes (nm) under certain experimental conditions was read from
Question:
The accompanying summary data on CeO2 particle sizes (nm) under certain experimental conditions was read from a graph in the article "Nanoceria—Energetics of Surfaces, Interfaces and Water Adsorption" (J. of the Amer. Ceramic Soc., 2011: 3992-3999):
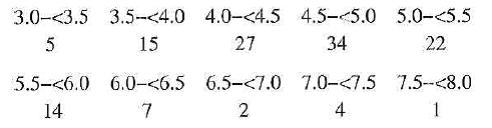
a. What proportion of the observations are less than 5?
b. What proportion of the observations are at least 6?
c. Construct a histogram with relative frequency on the vertical axis and comment on interesting features. In particular, does the distribution of particle sizes appear to be reasonably symmetric or somewhat skewed? [Note: The investigators fit a lognormal distribution to the data; this is dis-cussed in Chapter 4.]
d. Construct a histogram with density on the vertical axis and compare to the histogram in (c).
Expert Answer: