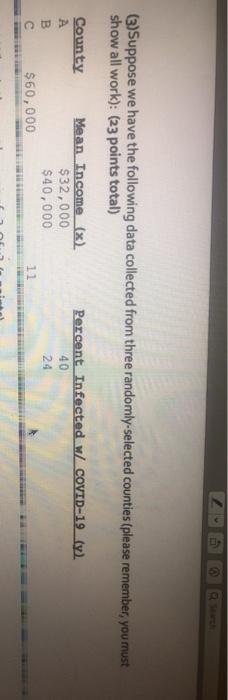
Question: love the tonowing data collected from three randomly selected counties (please remember, you must Show all work): (23 points total) County Mean Income (x) A
love the tonowing data collected from three randomly selected counties (please remember, you must Show all work): (23 points total) County Mean Income (x) A $32,000 $40,000 $60,000 Percent Infected w/ COVID-19 (y) 40 c (What is the appropriate critical t at the 99% confidence level? decimal places) (a point) (9) According to the data and your findings above (particularly your answers to (d) and (), ble statistically appropriate to conclude that a county's mean income is related to its percentage who are infected with COVID:19? How do you Justify this conclusion? (s points) Asa research analyst, what might you do with particular reference to data collection to it up your conclude (le to obtain a more precise understanding of the relationship between income and infection) la points) 2 (3)Suppose we have the following data collected from three randomly selected counties (please remember, you must show all work): (23 points total) County Mean Income (x) Percent Infected w/ COVID-19 (y). A $32,000 B $40,000 $60,000 40 24 12 () What is the appropriate critical t at the 99% confidence level? (3 decimal places) (2 point) () According to the data and your findings above (particularly your answers to (d) and (f), isit statistically appropriate to conclude that a county's mean income is related to its percentage who are infected with COVID-19? How do you justify this conclusion? (5 points) As a research analyst, what might you do - with particular reference to data collection - to "firm up your conclusion (ie, to obtain a more precise understanding of the relationship between income and infection)? (3 points) love the tonowing data collected from three randomly selected counties (please remember, you must Show all work): (23 points total) County Mean Income (x) A $32,000 $40,000 $60,000 Percent Infected w/ COVID-19 (y) 40 c (What is the appropriate critical t at the 99% confidence level? decimal places) (a point) (9) According to the data and your findings above (particularly your answers to (d) and (), ble statistically appropriate to conclude that a county's mean income is related to its percentage who are infected with COVID:19? How do you Justify this conclusion? (s points) Asa research analyst, what might you do with particular reference to data collection to it up your conclude (le to obtain a more precise understanding of the relationship between income and infection) la points) 2 (3)Suppose we have the following data collected from three randomly selected counties (please remember, you must show all work): (23 points total) County Mean Income (x) Percent Infected w/ COVID-19 (y). A $32,000 B $40,000 $60,000 40 24 12 () What is the appropriate critical t at the 99% confidence level? (3 decimal places) (2 point) () According to the data and your findings above (particularly your answers to (d) and (f), isit statistically appropriate to conclude that a county's mean income is related to its percentage who are infected with COVID-19? How do you justify this conclusion? (5 points) As a research analyst, what might you do - with particular reference to data collection - to "firm up your conclusion (ie, to obtain a more precise understanding of the relationship between income and infection)? (3 points)