

Question: Low Stakes Assignment 7. Very carefully review the figures below and answer the questions that follow(upload into blackboard by Oct 13, 2020 midnight) What were
Low Stakes Assignment 7. Very carefully review the figures below and answer the questions that follow(upload into blackboard by Oct 13, 2020 midnight)
-
What were CBR, CDR, CNMR, CRNI and r in 1910?
-
What were CBR, CDR, CNMR, CRNI and r in 2010?
-
Describe the broad trend in the CBR between 1910 and 2010? What do you think accounts for the trend?
-
Describe the broad trend in the CDR between 1910 and 2010.? What do you think accounts for the trend?
-
Describe the broad trend in the CNMR between 1910 and 2010? What do you think accounts for the trend?
-
Describe the broad trend in the CRNI between 1910 and 201? What do you think accounts for the trend?
-
Describe the broad trend in r between 1910 and 2010? What do you think accounts for the trend?
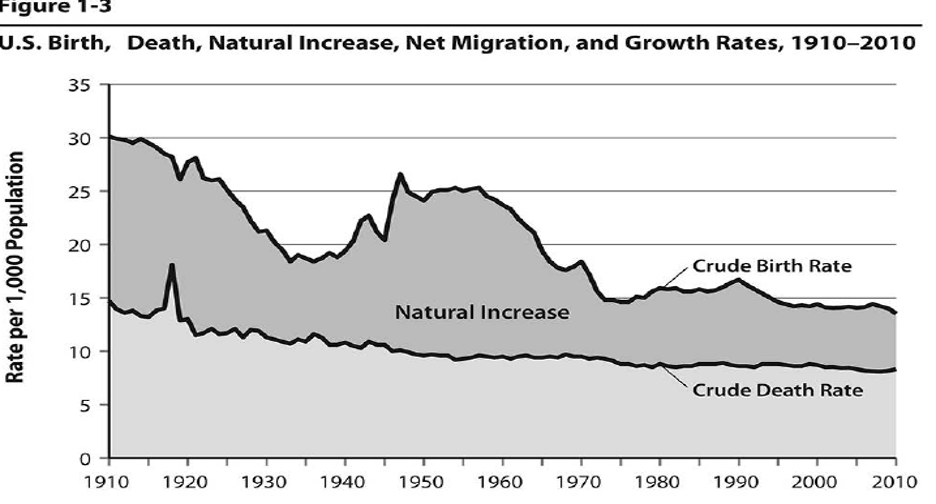
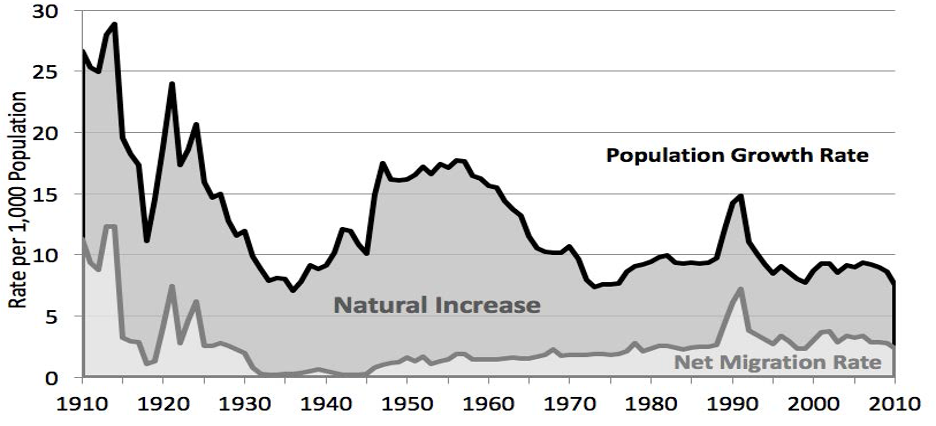
Figure 1-3 U.S. Birth, Death, Natural Increase, Net Migration, and Growth Rates, 1910-2010 35 30 25 20 Rate per 1,000 Population Crude Birth Rate 15 Natural Increase 10 Crude Death Rate 5 0 1910 1920 1930 1940 1950 1960 1970 1980 1990 2000 2010 30 25 20 Population Growth Rate Rate per 1,000 Population 15 10 Natural Increase 5 Net Migration Rate o 1910 1920 1930 1940 1950 1960 1970 1980 1990 2000 2010 Figure 1-3 U.S. Birth, Death, Natural Increase, Net Migration, and Growth Rates, 1910-2010 35 30 25 20 Rate per 1,000 Population Crude Birth Rate 15 Natural Increase 10 Crude Death Rate 5 0 1910 1920 1930 1940 1950 1960 1970 1980 1990 2000 2010 30 25 20 Population Growth Rate Rate per 1,000 Population 15 10 Natural Increase 5 Net Migration Rate o 1910 1920 1930 1940 1950 1960 1970 1980 1990 2000 2010
Step by Step Solution
There are 3 Steps involved in it

Get step-by-step solutions from verified subject matter experts