

Question: Lowe's company 2. Trend Analysis: Prepare a variance (horizontal) analysis for the three most current years for each of the tinancial statements listed below. Provide
 Lowe's company
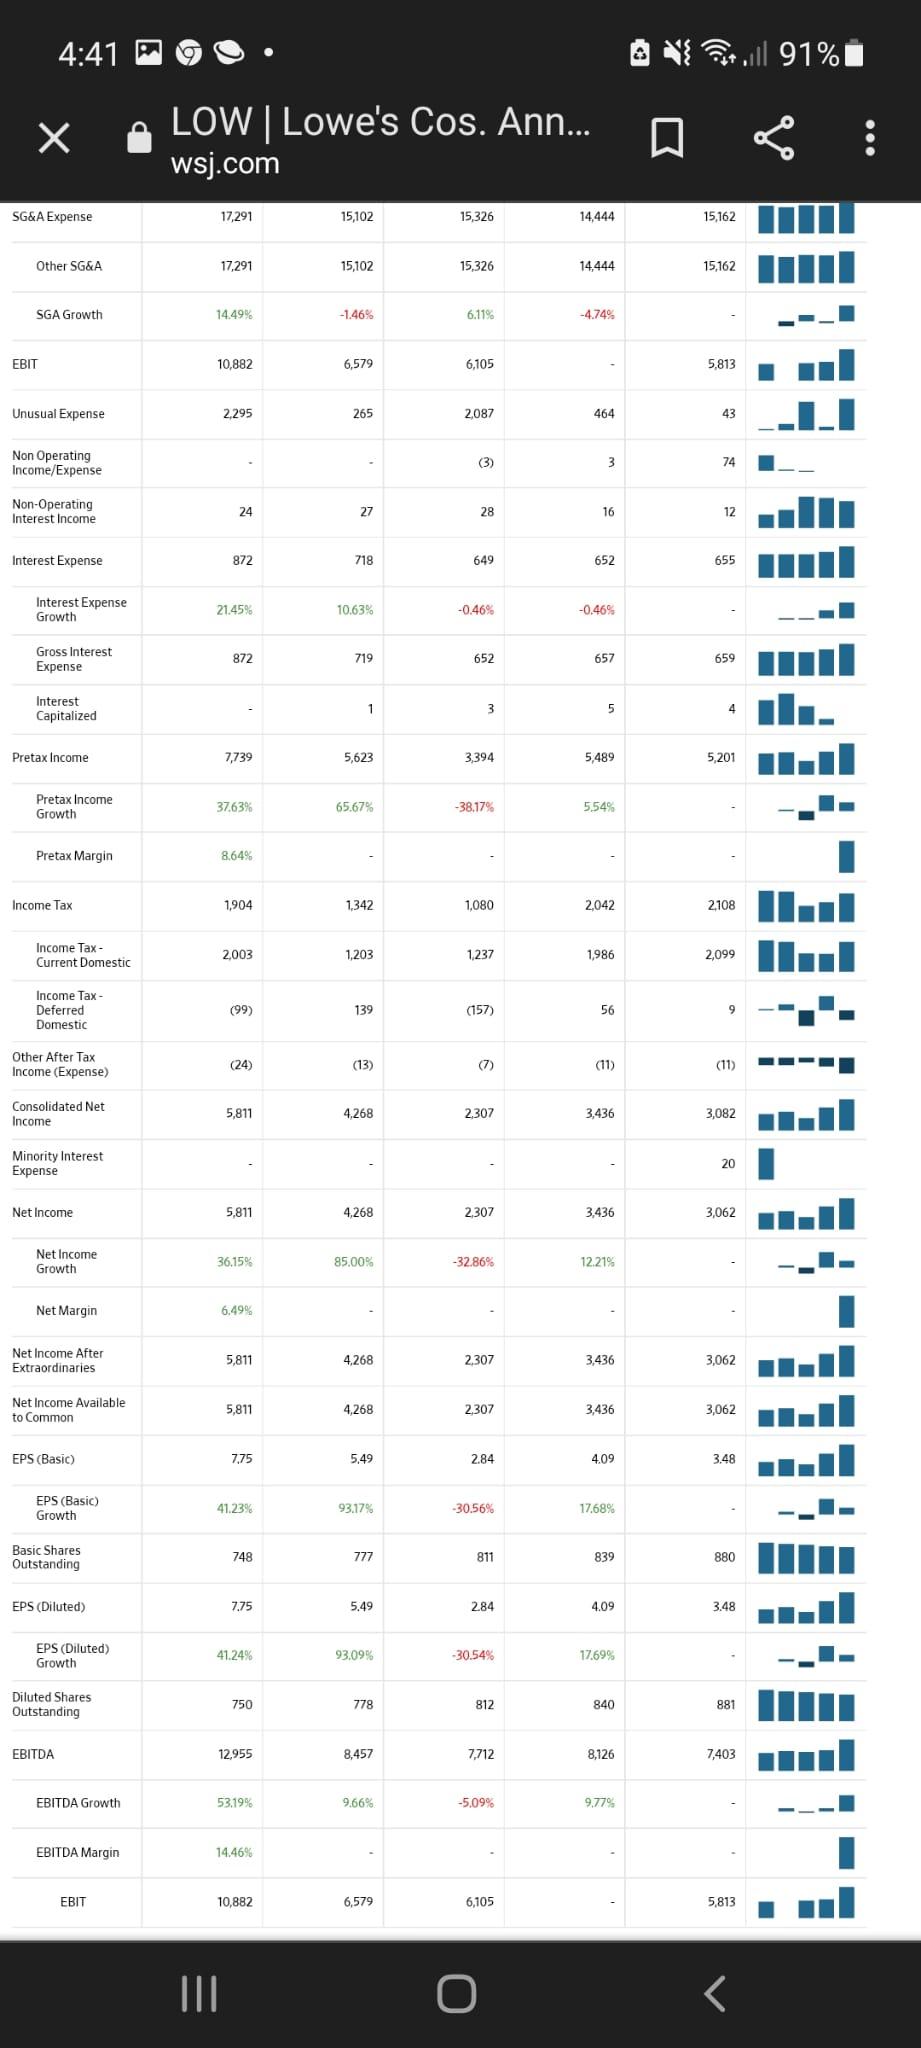
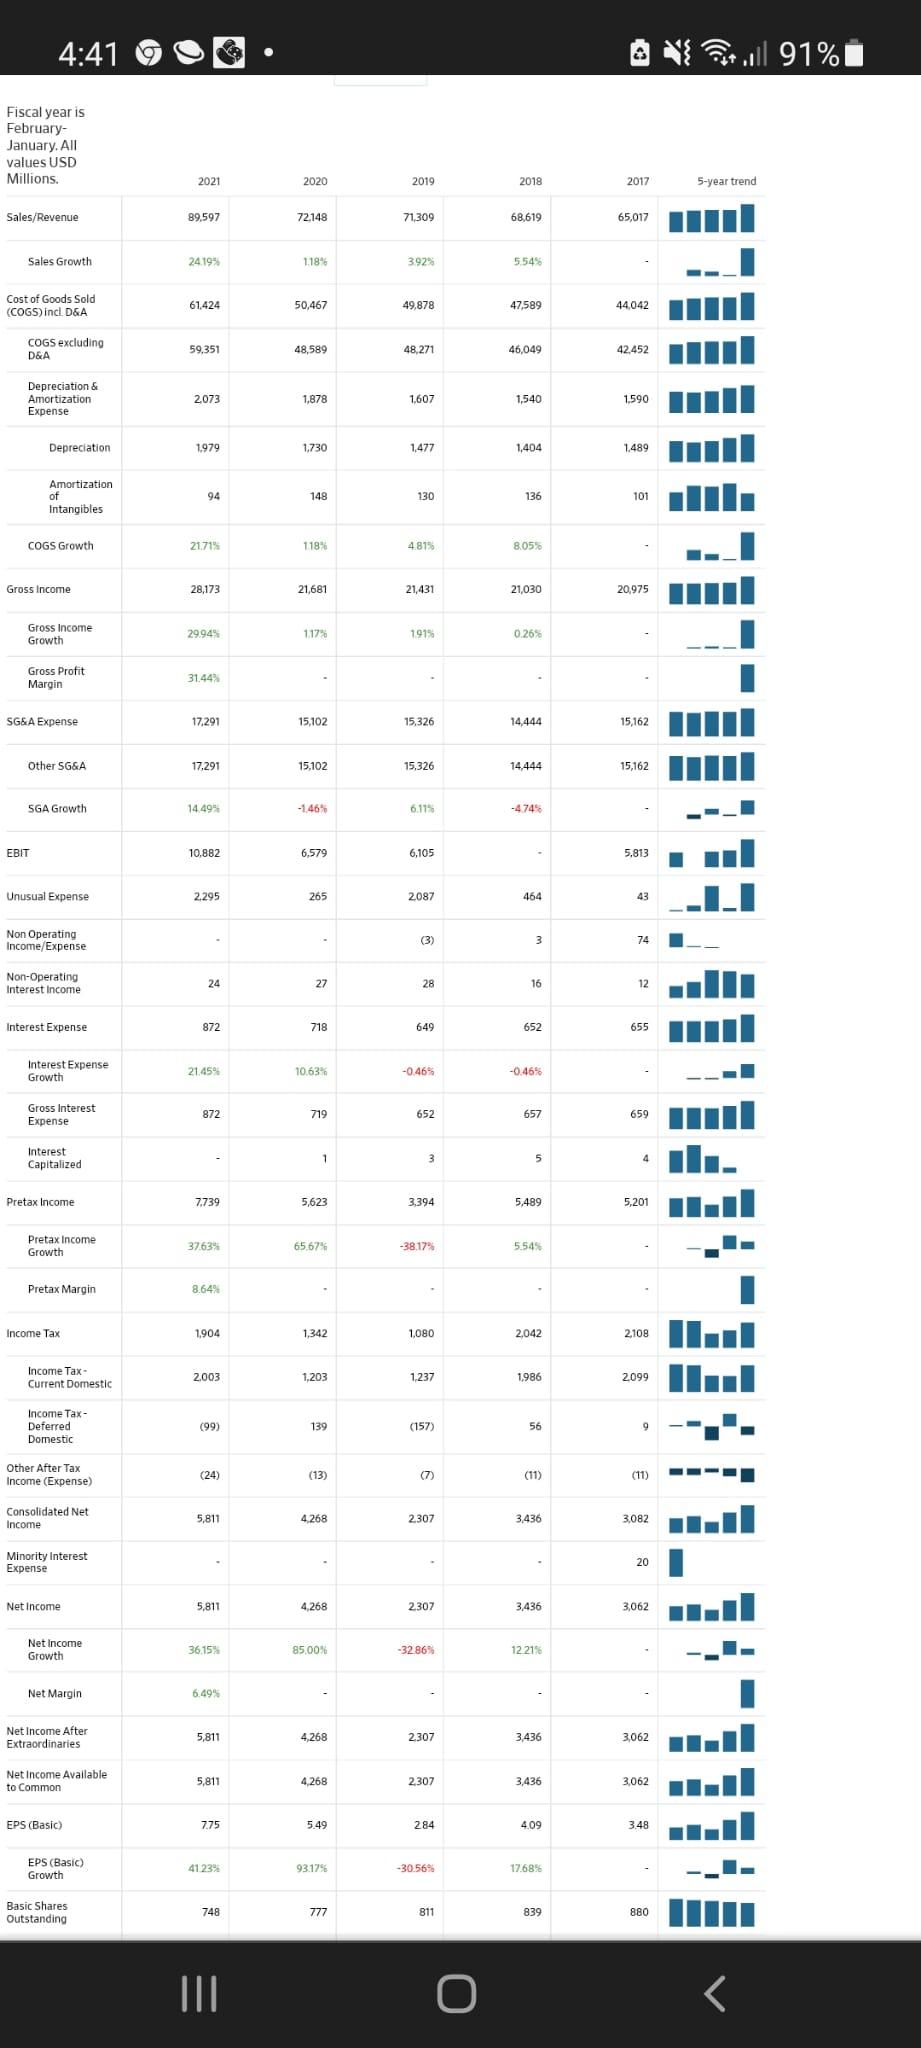
2. Trend Analysis: Prepare a variance (horizontal) analysis for the three most current years for each of the tinancial statements listed below. Provide an explanation for significant variances in the financial statement line items. Do not select totals / subtotals eg. total assets, total liabilities, net income, etc). For each statement, a minimum of 2-3 line items should be supported by an explanation, but not less than 5 in total. A. Balance Sheet B. Income Statement 4:41 Pituull 91% Fiscal year is February January. All values USD Millions. 2021 2020 2019 2018 2017 5-year trend Sales/Revenue 89.597 72.148 71,309 68,619 65,017 Sales Growth 2419% 1.18% 392 554% Cost of Goods Sold (COGS) incl. D&A 61.424 50,467 49,878 47,589 44042 COGS excluding D&A 59,351 48,589 48,271 46,049 42452 Depreciation & Amortization Expense 2.073 1,878 1,607 1,540 1.590 Depreciation 1979 1730 1,477 1,404 1.489 Amortization of Intangibles 94 148 130 136 101 COGS Growth 21.71% 118% 4815 805 Gross Income 28,173 21,681 21.431 21.030 20,975 Gross Income Growth 29.94% 117% 1919 0.26% Gross Profit Margin 31.44% SG&A Expense 17.291 15,102 15,326 14.444 15,162 Other SG&A 17,291 15.102 15,326 14.444 15,162 SGA Growth 14.49% -146% 6.115 -4745 EBIT 10.882 6,579 6,105 5,813 Unusual Expense 2.295 265 2087 464 43 Non Operating Income/Expense (3) 3 74 Non-Operating Interest Income 24 27 28 16 12 Interest Expense 872 718 649 652 655 Interest Expense Growth 21.45% 10.63% -0.46% -0.46% Gross Interest Expense 872 719 652 657 659 Interest Capitalized 1 3 5 Pretax Income 7.739 5,623 3,394 5.489 5,201 Pretax Income Growth 37.63% 65.67% -38.17% 5.545 Pretax Margin 8.64% Income Tax 1.904 1.342 1,080 2,042 2,108 Income Tax Current Domestic 2.003 1,203 1.237 1986 2099 Income Tax- Deferred Domestic (99) 139 (157) 56 Other After Tax Income (Expense) (24) (13) (7) (11) (11) Consolidated Net Income 5,811 4.268 2307 3,436 3,082 Minority Interest Expense 20 Net Income 5,811 4,268 2307 3,436 3,062 Net Income Growth 36.15% 85,00% -3286% 12 21% Net Margin 6.49% Net Income After Extraordinaries 5,811 4,268 2307 3,436 3,062 Net Income Available to Common 5,811 4,268 2307 3,436 3,062 EPS (Basic 7.75 5.49 284 4.09 3.48 EPS (Basic) Growth 41.23% 93.17% -30.56% 17.68% Basic Shares Outstanding 748 777 811 839 880 TIL
Step by Step Solution
There are 3 Steps involved in it

Get step-by-step solutions from verified subject matter experts