

Question: LP CASE: LANDIS DISTRIBUTION SYSTEM DESIGN ( PLEASE ANSWER 1 - 3 ) The Landis Company manufactures and distributes meters used to measure electric power
LP CASE: LANDIS DISTRIBUTION SYSTEM DESIGNPLEASE ANSWER
The Landis Company manufactures and distributes meters used to measure electric power consumption. The company started with a small production plant in EL Paso and gradually built a customer base throughout Texas. A distribution center was established in Worth, Texas, and later, as business expanded to the north, a second distribution center was established in Santa Fe New Mexico.
The EL Paso plant was expanded when the company began marketing its meters in Arizona, California, Nevada, and Utah. With the growth of the West Coast business, the Landis Company opened a third distribution center in Las Vegas and just two years ago opened a second production plant in San Bernardino, California.
Manufacturing costs differ between the company's production plants. The cost of each meter produced at the EL Paso plant is $ The San Bernardino plant utilizes newer and more efficient equipment; as a result, manufacturing costs are $ per meter less than at the EL Paso plant.
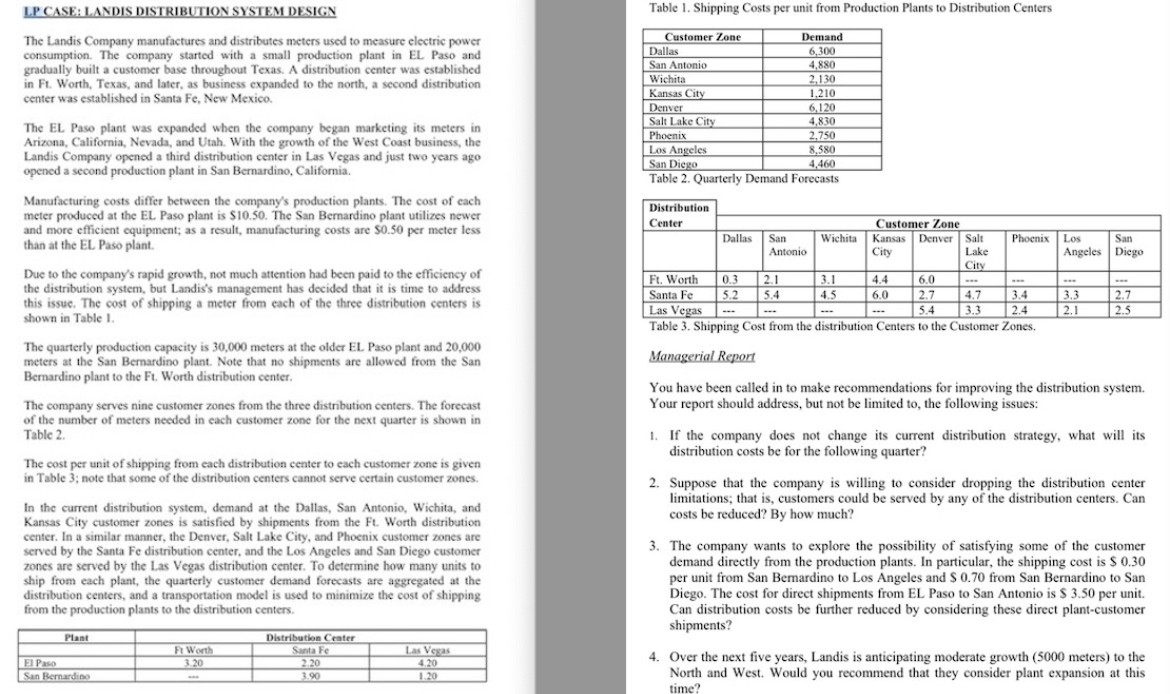
Due to the company's rapid growth, not much attention had been paid to the efficiency of the distribution system, but Landis's management has decided that it is time to address this issue. The cost of shipping a meter from each of the three distribution centers is shown in Table
The quarterly production capacity is meters at the older EL Paso plant and meters at the San Bernardino plant. Note that no shipments are allowed from the San Bernardino plant to the Ft Worth distribution center.
The company serves nine customer zones from the three distribution centers. The forecast of the number of meters needed in each customer zone for the next quarter is shown in Table
The cost per unit of shipping from each distribution center to each customer zone is given in Table ; note that some of the distribution centers cannot serve certain customer zones.
In the current distribution system, demand at the Dallas, San Antonio, Wichita, and Kansas City customer zones is satisfied by shipments from the Ft Worth distribution center. In a similar manner, the Denver, Salt Lake City, and Phoenix customer zones are served by the Santa Fe distribution center, and the Los Angeles and San Diego customer zones are served by the Las Vegas distribution center. To determine how many units to ship from each plant, the quarterly customer demand forecasts are aggregated at the distribution centers, and a transportation model is used to minimize the cost of shipping from the production plants to the distribution centers.
tablePlantDistribation CeaterFiWerth,Santa FeLas VegasElPasoSan Bernardino,
tableFlantDistribation CeaterFi Worth,Santa FeLas VegasElPasoSan Bernardino,
Table Shipping Costs per unit from Production Plants to Distribution Centers
tableCustomer Zone,DemandDallasSan Antonio,WichitaKansas City,DenverSalt Lake City,PhoenixLos Angeles,San Diego,
Table Quarterly Demand Forecasts
tabletableDistributionCenterCustomer ZoneDallastableSanAntonioWichita,tableKansasCityDenver,tableSaltLakeCityPhoenix,tableLosAngelestableSanDiegoFt Worth,dotsdots,dots,dots,,,,,,,,,,,,,,,,,,,,,,,,,,,,,,,,,,,,,,,,,,,,,,,,,,,,,,,,,,,,,,,,,,,,,,,Santa FeLas Vegas,dotsdotsdots
Table Shipping Cost from the distribution Centers to the Customer Zones.
Managerial Report
You have been called in to make recommendations for improving the distribution system. Your report should address, but not be limited to the following issues:
If the company does not change its current distribution strategy, what will its distribution costs be for the following quarter?
Suppose that the company is willing to consider dropping the distribution center limitations; that is customers could be served by any of the distribution centers. Can costs be reduced? By how much?
The company wants to explore the possibility of satisfying some of the customer demand directly from the production plants. In particular, the shipping cost is $ per unit from San Bermardino to Los Angeles and S from San Bernardino to San Diego. # requires a objective function, and number and number should be displayed using Linear Programming
Step by Step Solution
There are 3 Steps involved in it
1 Expert Approved Answer
Step: 1 Unlock

Question Has Been Solved by an Expert!
Get step-by-step solutions from verified subject matter experts
Step: 2 Unlock
Step: 3 Unlock