

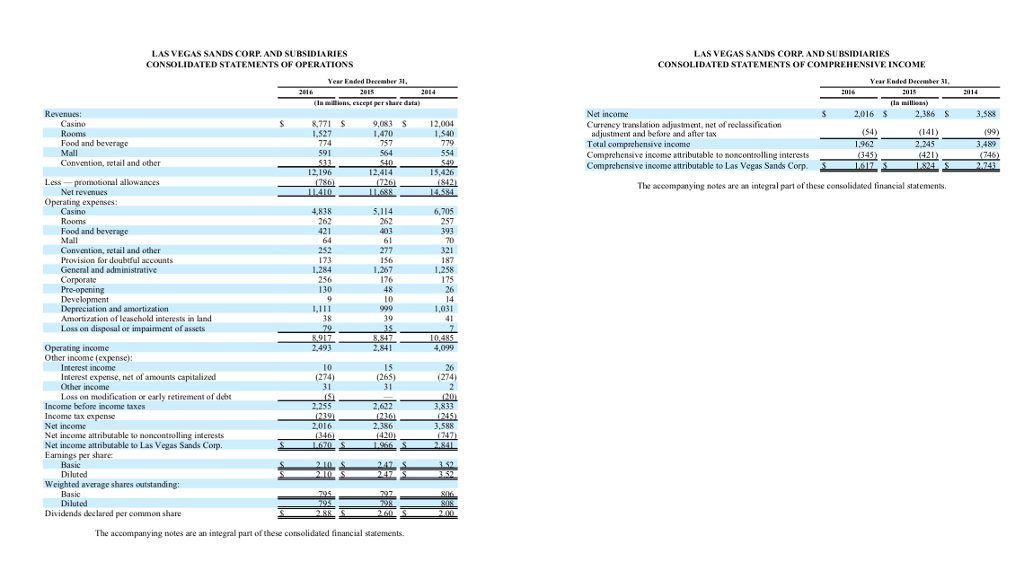
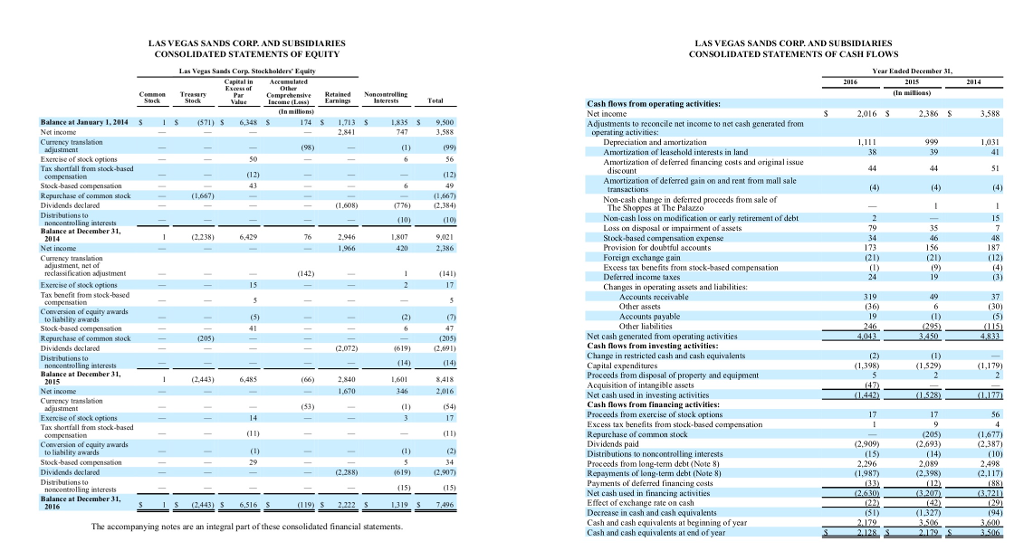
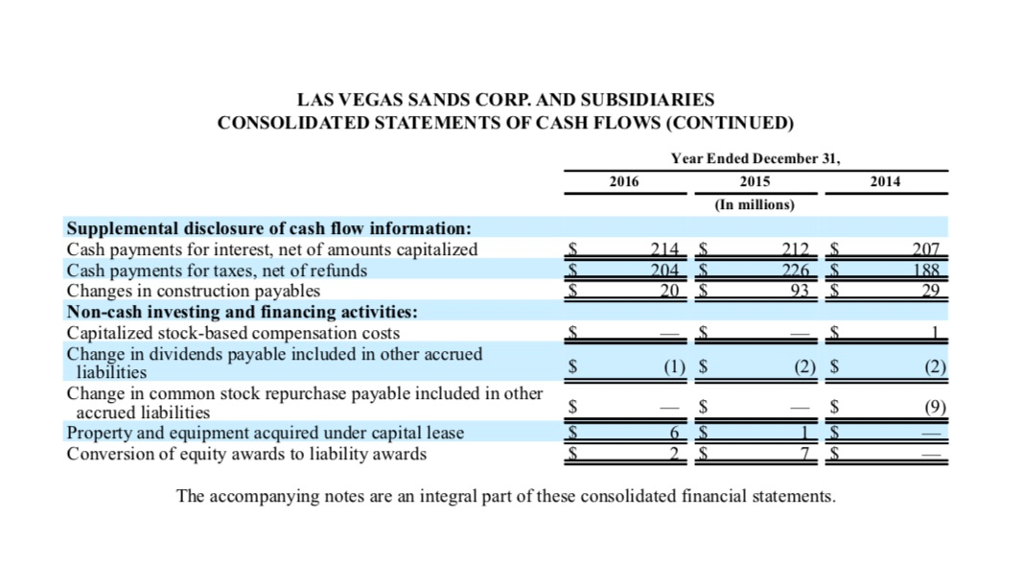
Question: LV sands 2016 and MGM 2016 Part 5 - Ratio Analysis LVSands Current Year Previous Year (SHOW THE FORMULA) Formula Answer Formula Answer Liquidity Ratios
|
Part 5 - Ratio Analysis | LVSands | Current Year | Previous Year | ||||||
| (SHOW THE FORMULA) | Formula | Answer | Formula | Answer | |||||
| Liquidity Ratios | |||||||||
| 1. | Current ratio | Current assets | |||||||
| (X.XX : 1) | Current liabilities | ||||||||
| 2. | Acid-test (quick) ratio | Cash + ST Investments + Receivables (net) | |||||||
| (X.XX : 1) | Current liabilities | ||||||||
| 3. | Receivables turnover | Net Sales | |||||||
| (times) | Average net receivables | ||||||||
| Avg. collection period | 365 | ||||||||
| (days) | Receivables turnover | ||||||||
| 4. | Inventory turnover | Cost of Goods Sold | |||||||
| (times) | Average inventory | ||||||||
| Avg days inventory held | 365 | ||||||||
| (days) | Inventory turnover | ||||||||
| Profitability Ratios | |||||||||
| 5. | Profit margin | Net income | |||||||
| (%) | Net sales or operating revenues | ||||||||
| 6. | Asset turnover | Net sales or operating revenues | |||||||
| (times) | Average assets | ||||||||
| 7. | Return on assets | Net income | |||||||
| (%) | Average assets | ||||||||
| 8. | Return on common | Net income | |||||||
| stockholders' equity | Average common stockholders' equity | ||||||||
| (%) | |||||||||
| 9. | Earnings per share (EPS) | Net income | |||||||
| Weighted averge common shares outstanding | |||||||||
| 10. | Price-earnings (P-E) ratio | Market price per share of stock | |||||||
| (times) | Earnings per share | ||||||||
| 11. | Payout ratio | Cash dividends | |||||||
| (%) | Net income | ||||||||
| Solvency ratios | |||||||||
| 12. | Debt to total assets ratio | Total debt(liabilites) | |||||||
| (%) | Total assets | ||||||||
| 13. | Times interest earned | Income before income taxes and interest exp | |||||||
| (times) | Interest expense | ||||||||
| 14. | Free cash flow | Cash provided by operating activities - Capital expenditures - Cash dividends | |||||||
| Part 5 - Ratio Analysis | MGM | Current Year | Previous Year | ||||||
| (SHOW THE FORMULA) | Formula | Answer | Formula | Answer | |||||
| Liquidity Ratios | |||||||||
| 1. | Current ratio | Current assets | |||||||
| (X.XX : 1) | Current liabilities | ||||||||
| 2. | Acid-test (quick) ratio | Cash + ST Investments + Receivables (net) | |||||||
| (X.XX : 1) | Current liabilities | ||||||||
| 3. | Receivables turnover | Net sales | |||||||
| (times) | Average net receivables | ||||||||
| Avg. collection period | 365 | ||||||||
| (days) | Receivables turnover | ||||||||
| 4. | Inventory turnover | Cost of Goods Sold | |||||||
| (times) | Average inventory | ||||||||
| Avg days inventory held | 365 | ||||||||
| (days) | Inventory turnover | ||||||||
| Profitability Ratios | |||||||||
| 5. | Profit margin | Net income | |||||||
| (%) | Net sales or operating revenues | ||||||||
| 6. | Asset turnover | Net sales or operating revenues | |||||||
| (times) | Average assets | ||||||||
| 7. | Return on assets | Net income | |||||||
| (%) | Average assets | ||||||||
| 8. | Return on common | Net income | |||||||
| stockholders' equity | Average common stockholders' equity | ||||||||
| (%) | |||||||||
| 9. | Earnings per share (EPS) | Net income | |||||||
| Weighted averge common shares outstanding | |||||||||
| 10. | Price-earnings (P-E) ratio | Market price per share of stock | |||||||
| (times) | Earnings per share | ||||||||
| 11. | Payout ratio | Cash dividends | |||||||
| (%) | Net income | ||||||||
| Solvency ratios | |||||||||
| 12. | Debt to total assets ratio | Total debt(liabilites) | |||||||
| (%) | Total assets | ||||||||
| 13. | Times interest earned | Income before income taxes and interest exp | |||||||
| (times) | Interest expense | ||||||||
| 14. | Free cash flow | Cash provided by operating activities - Capital expenditures - Cash dividends | |||||||
 LV sands 2016 and MGM 2016
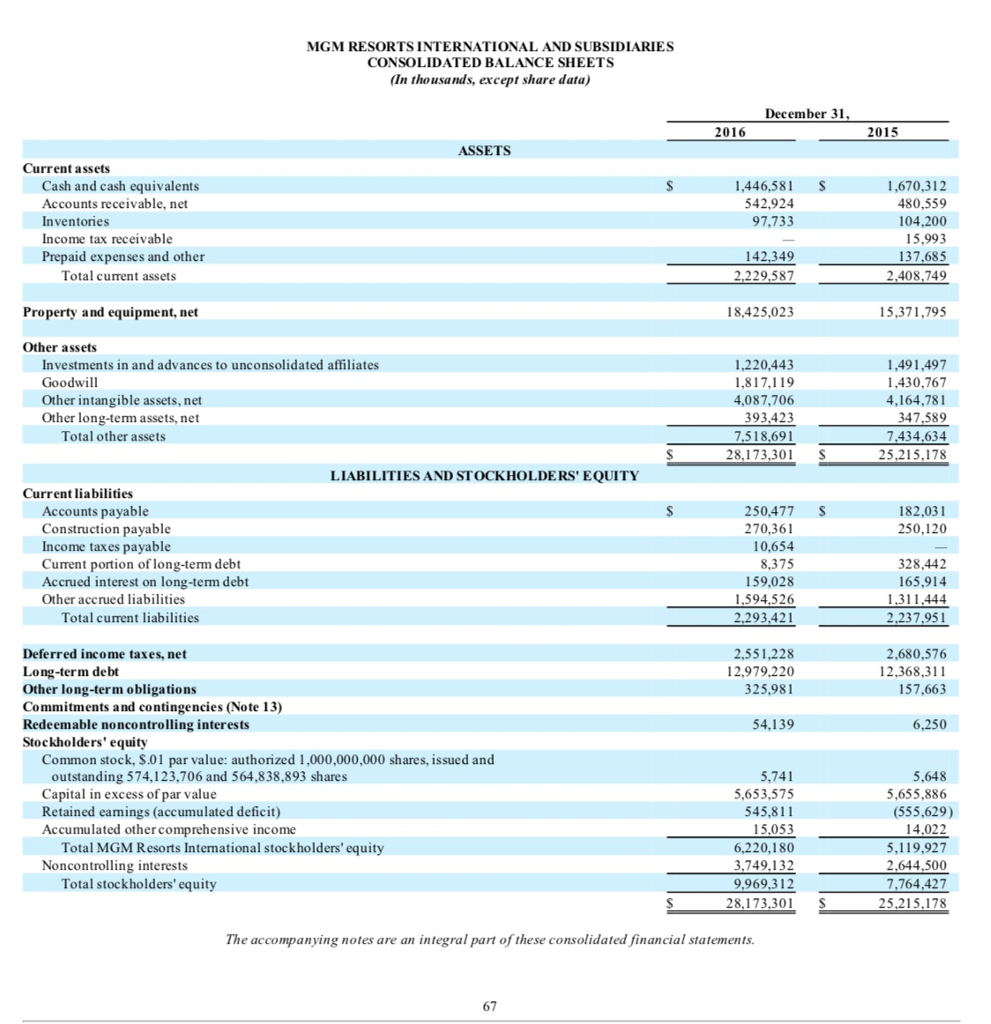
MGM RESORTSINTERNATIONAL AND SUBSIDIARIES CONSOLIDATED BALANCE SHEETS In thousands, except share data) December 31 2015 ASSETS Current assets 1,446,581 S Cash and cash equivalents Accounts receivable, net Inventories Income tax receivable Prepaid expenses and other 1,670,312 480,559 104,200 15,993 137,685 2.408,749 542,924 97,733 Total current assets 2,229,587 Property and equipment, net 18,425,023 5,371,795 Other assets Investments in and advances to unconsolidated affiliates Goodwill Other intangible assets, net Other long-term assets, net 1,491,497 1,430,76 4,164,781 1,220,443 4,087,706 393.423 347,589 Total other assets 7518.691 7434.634 25,215,178 28,173,301 S LIABILITIES AND STOCKHOLDERS' EQUITY Current liabilities 182,031 250,120 Accounts payable Construction payable Income taxes payable Current portion oflong-term debt Accrued interest on long-term debt Other acerued liabilities 250.477 S 270,361 10,654 328,442 165,914 159,028 1594,526 311.444 Total current liabilities 2,237,951 2,551,228 2979,220 325,981 2,680,576 2,368,311 157,663 Deferred income taxes, net Long-term debt Other long-term obligations Commitments and contingencies (Note 13) Redeemable noncontrolling interests Stockholders' equity 54,139 6,250 Common stock, $.01 par value: authorized 1,000,000,000 shares, issued and outstanding 574,123,706 and 564,838,893 shares Capital in excess of par value Retained eamings (accumulated deficit) Accumulated other comprehensive income 5,741 5,653,575 545,811 5,655,886 (555,629) 6,220,180 3.749,132 9,969,312 5,119,927 2.644,500 7,764.427 25,215,178 Total MGM Resorts Intemational stockholders' equity Noncontrolling interests Total stockholders' equity 28,173.301 S The accompanying notes are an integral part of these consolidated financial statements. MGM RESORTSINTERNATIONAL AND SUBSIDIARIES CONSOLIDATED BALANCE SHEETS In thousands, except share data) December 31 2015 ASSETS Current assets 1,446,581 S Cash and cash equivalents Accounts receivable, net Inventories Income tax receivable Prepaid expenses and other 1,670,312 480,559 104,200 15,993 137,685 2.408,749 542,924 97,733 Total current assets 2,229,587 Property and equipment, net 18,425,023 5,371,795 Other assets Investments in and advances to unconsolidated affiliates Goodwill Other intangible assets, net Other long-term assets, net 1,491,497 1,430,76 4,164,781 1,220,443 4,087,706 393.423 347,589 Total other assets 7518.691 7434.634 25,215,178 28,173,301 S LIABILITIES AND STOCKHOLDERS' EQUITY Current liabilities 182,031 250,120 Accounts payable Construction payable Income taxes payable Current portion oflong-term debt Accrued interest on long-term debt Other acerued liabilities 250.477 S 270,361 10,654 328,442 165,914 159,028 1594,526 311.444 Total current liabilities 2,237,951 2,551,228 2979,220 325,981 2,680,576 2,368,311 157,663 Deferred income taxes, net Long-term debt Other long-term obligations Commitments and contingencies (Note 13) Redeemable noncontrolling interests Stockholders' equity 54,139 6,250 Common stock, $.01 par value: authorized 1,000,000,000 shares, issued and outstanding 574,123,706 and 564,838,893 shares Capital in excess of par value Retained eamings (accumulated deficit) Accumulated other comprehensive income 5,741 5,653,575 545,811 5,655,886 (555,629) 6,220,180 3.749,132 9,969,312 5,119,927 2.644,500 7,764.427 25,215,178 Total MGM Resorts Intemational stockholders' equity Noncontrolling interests Total stockholders' equity 28,173.301 S The accompanying notes are an integral part of these consolidated financial statements
Step by Step Solution
There are 3 Steps involved in it

Get step-by-step solutions from verified subject matter experts