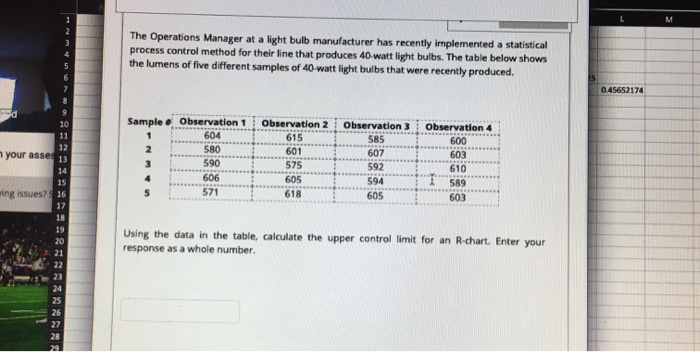
Question: M 2 3 4 The Operations Manager at a light bulb manufacturer has recently implemented a statistical process control method for their line that produces

M 2 3 4 The Operations Manager at a light bulb
M 2 3 4 The Operations Manager at a light bulb manufacturer has recently implemented a statistical process control method for their line that produces 40 watt light bulbs. The table below shows the lumens of five different samples of 40-watt light bulbs that were recently produced. 5 0.45652174 10 11 12 your asses 13 14 15 ing issues? 16 17 Sample 1 2 3 4 5 Observation 1 604 580 590 606 571 Observation 2 615 601 575 605 618 Observation 3 585 607 592 594 605 Observation 4 600 603 610 589 603 Using the data in the table, calculate the upper controllimit for an R-chart. Enter your response as a whole number 19 20 21 22 23 24 25 26 27 28

Step by Step Solution

There are 3 Steps involved in it

1 Expert Approved Answer
Step: 1 Unlock blur-text-image
Question Has Been Solved by an Expert!

Get step-by-step solutions from verified subject matter experts

Step: 2 Unlock
Step: 3 Unlock

Students Have Also Explored These Related General Management Questions!