Question: M N A B C D E F G H J K L Munjal Showa Limited- Financials Munjal Showa Limited- Income Statement Munjal Showa Limited-
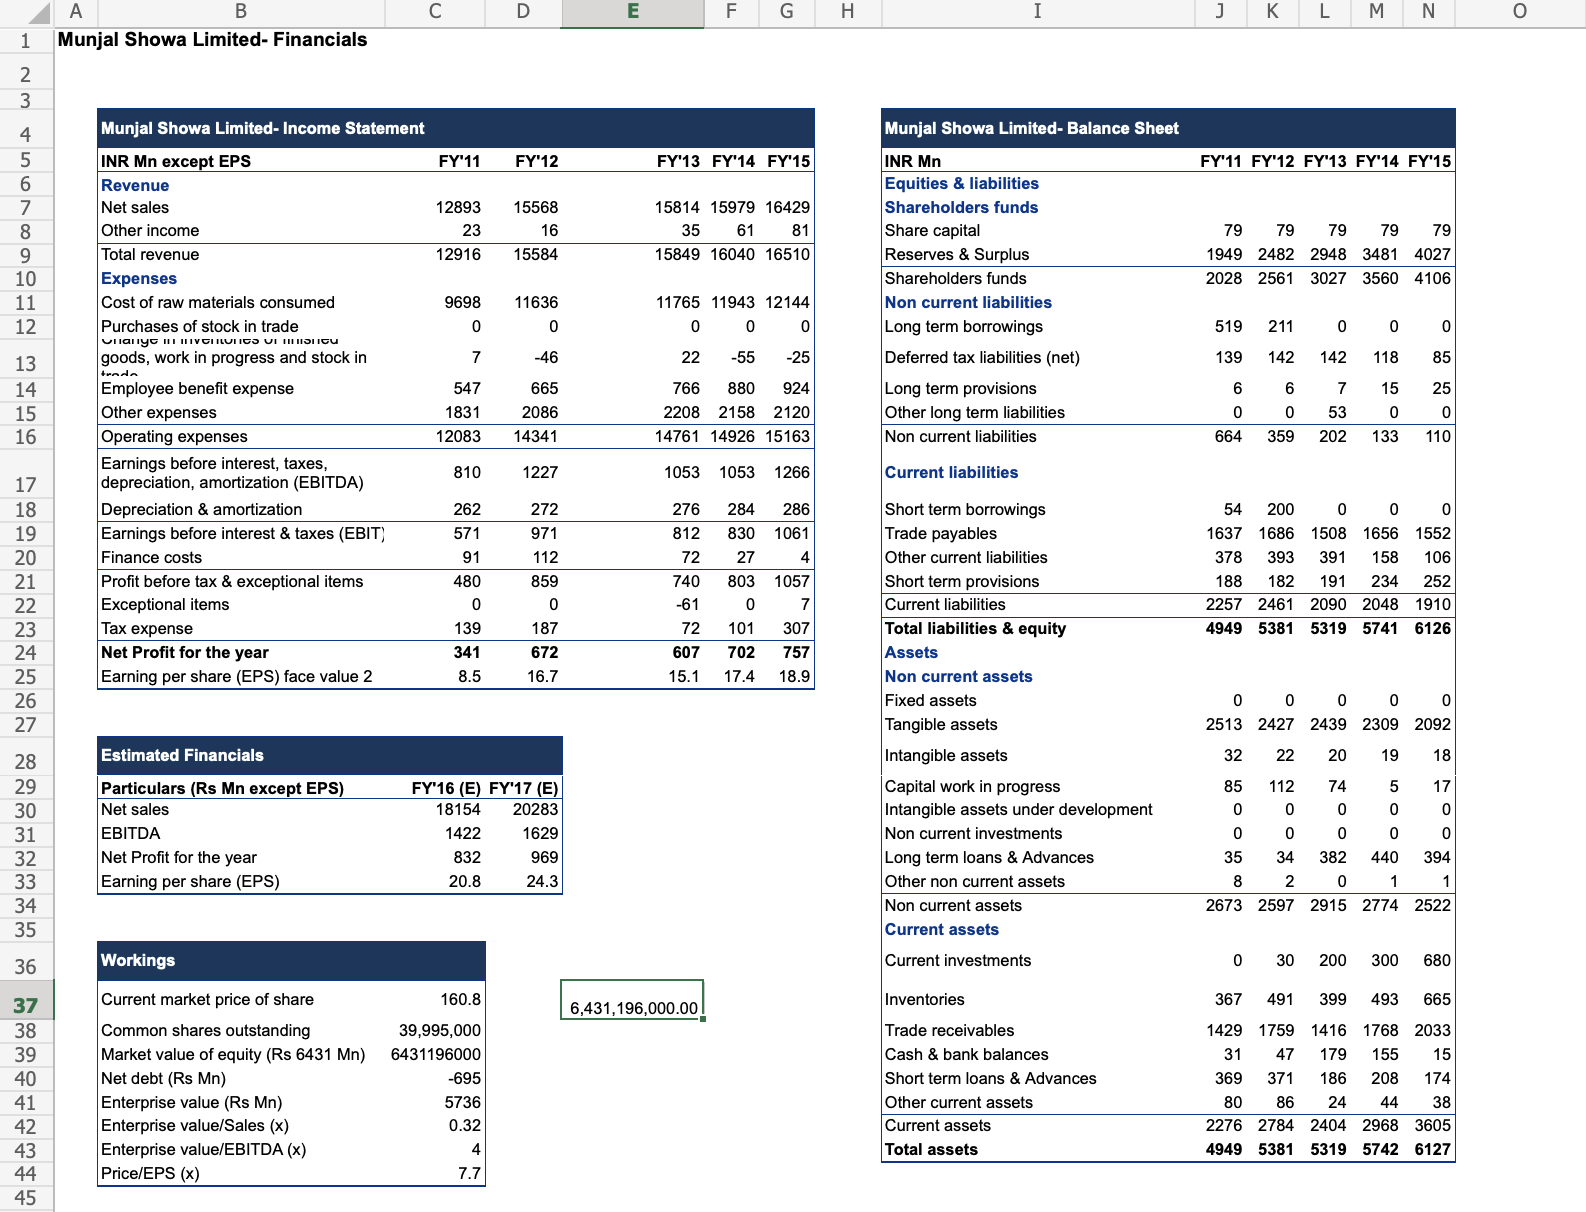
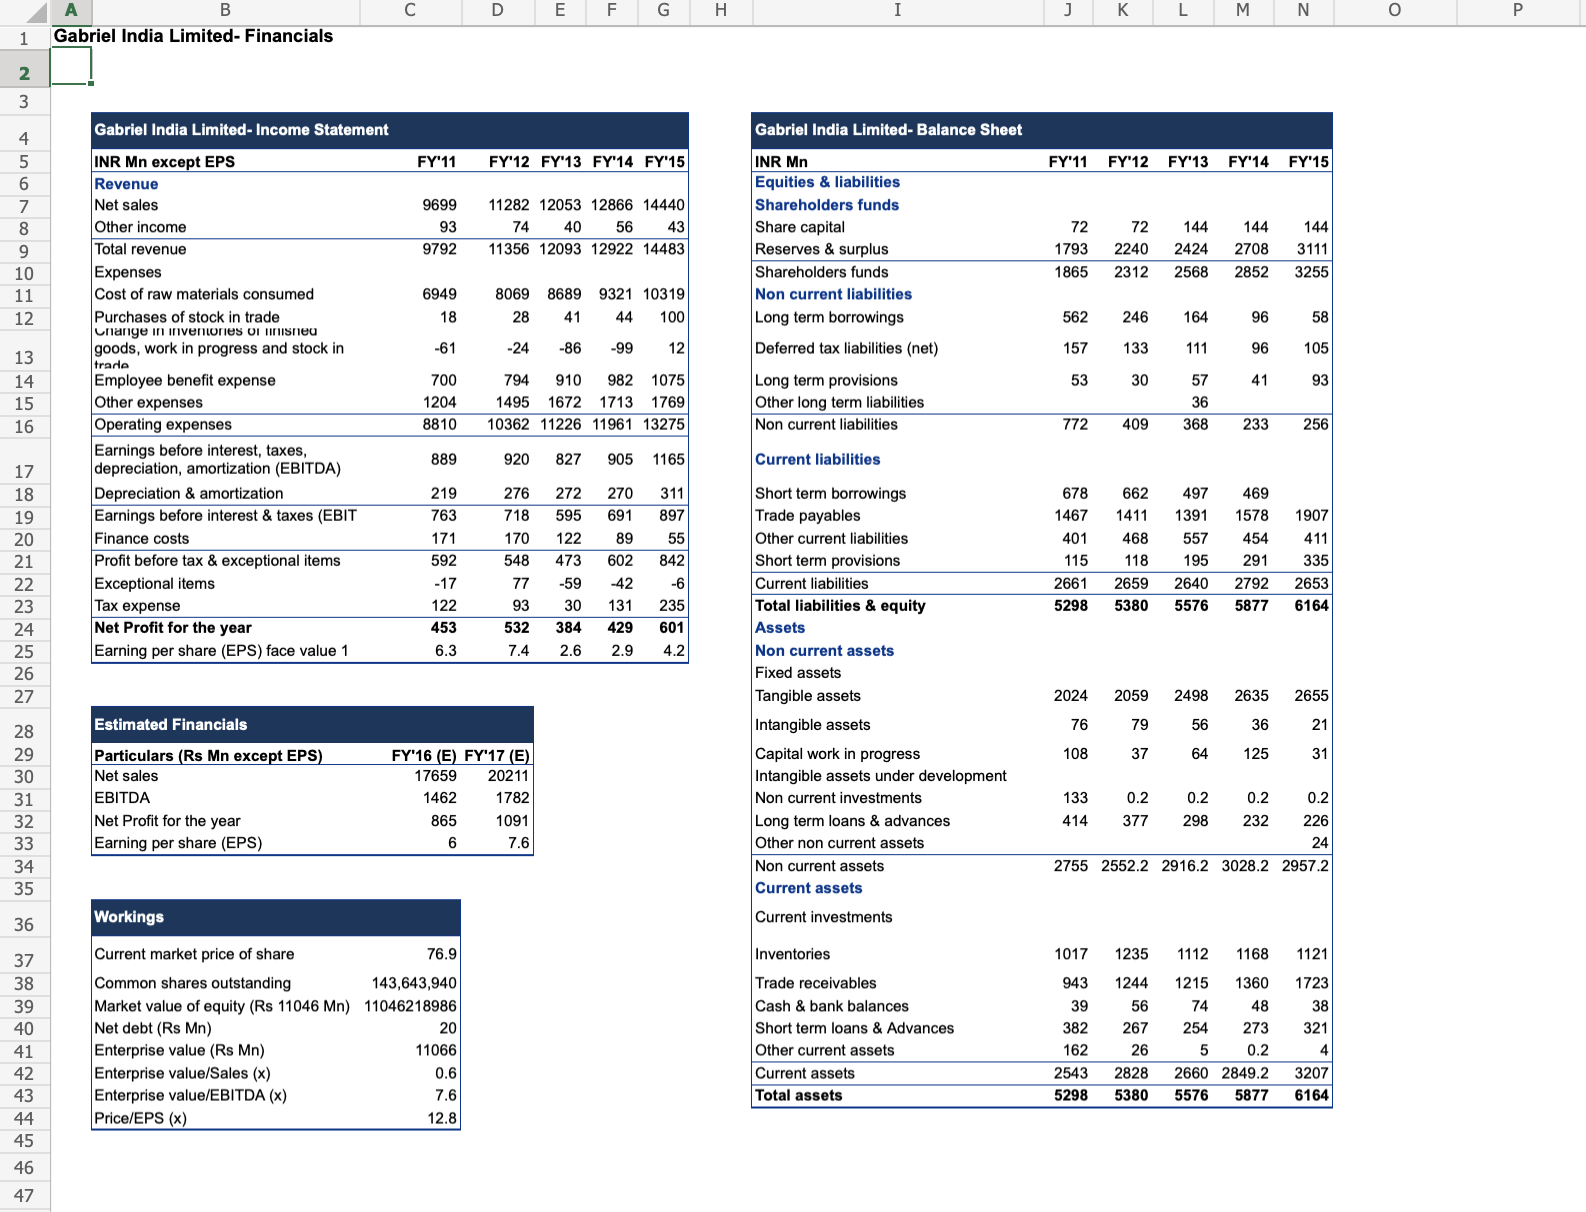
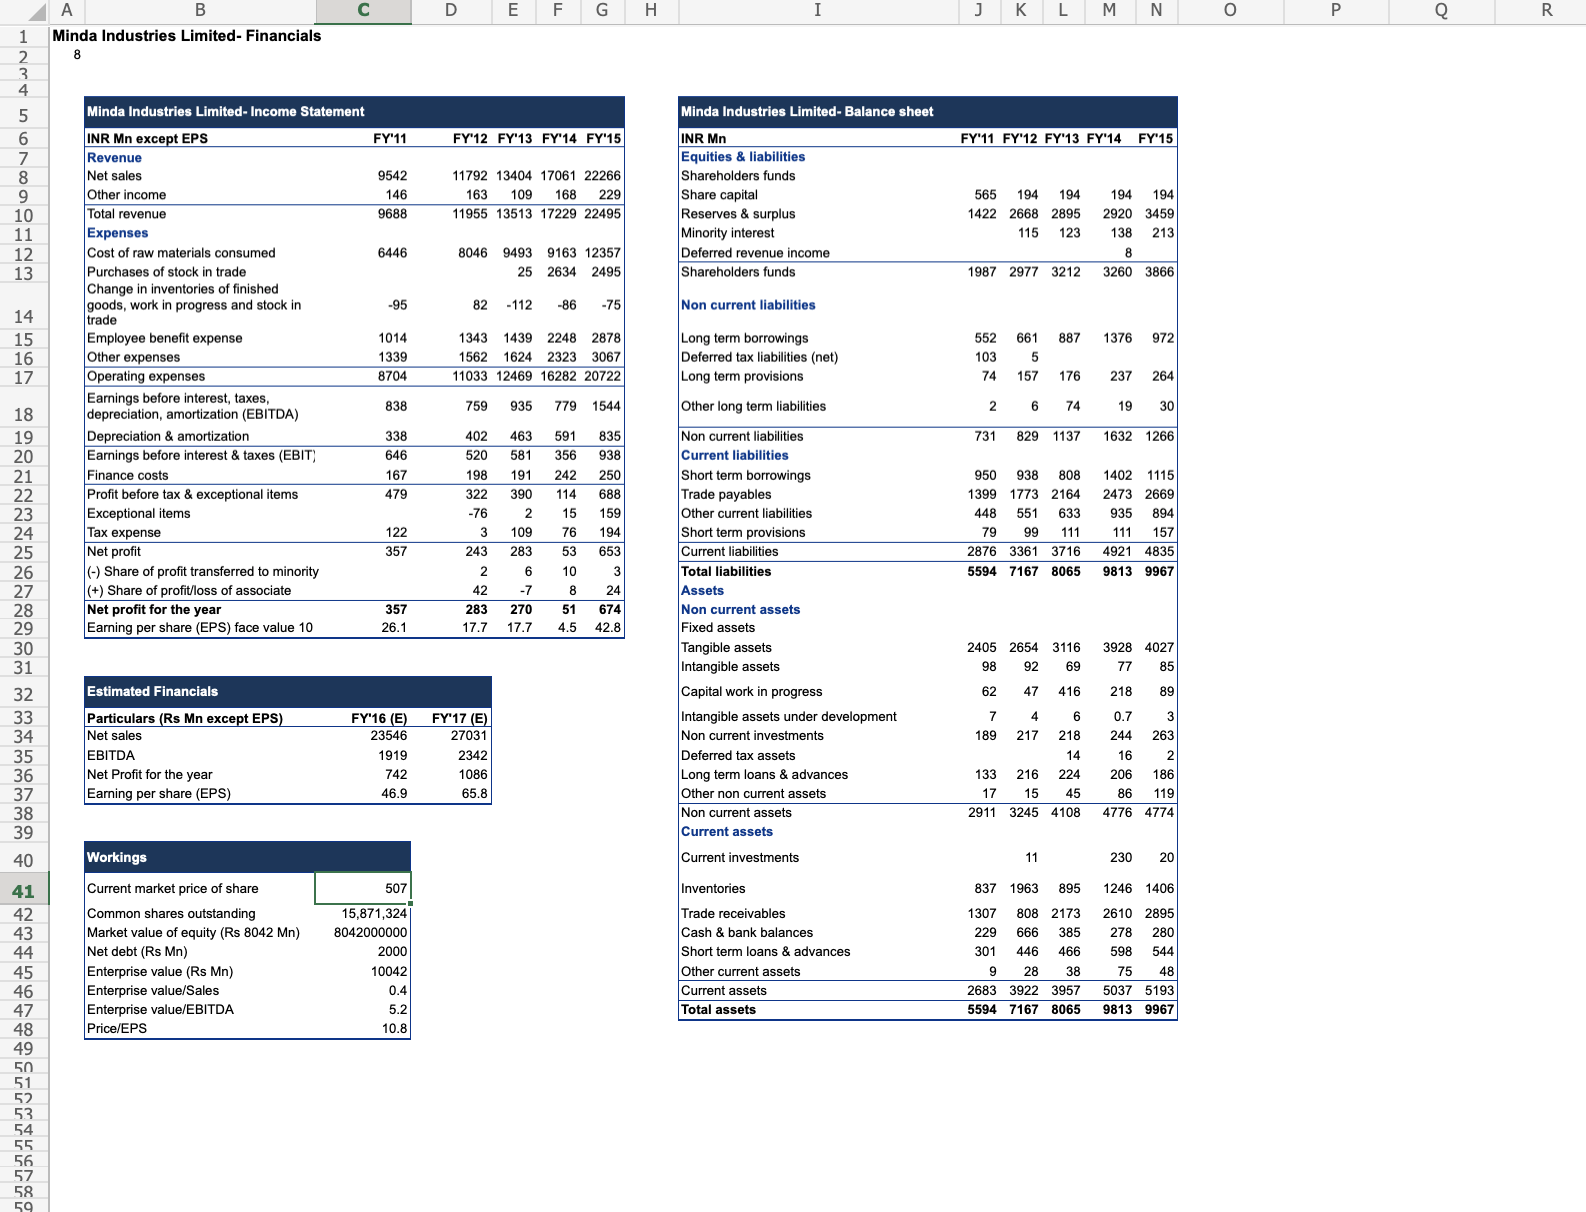
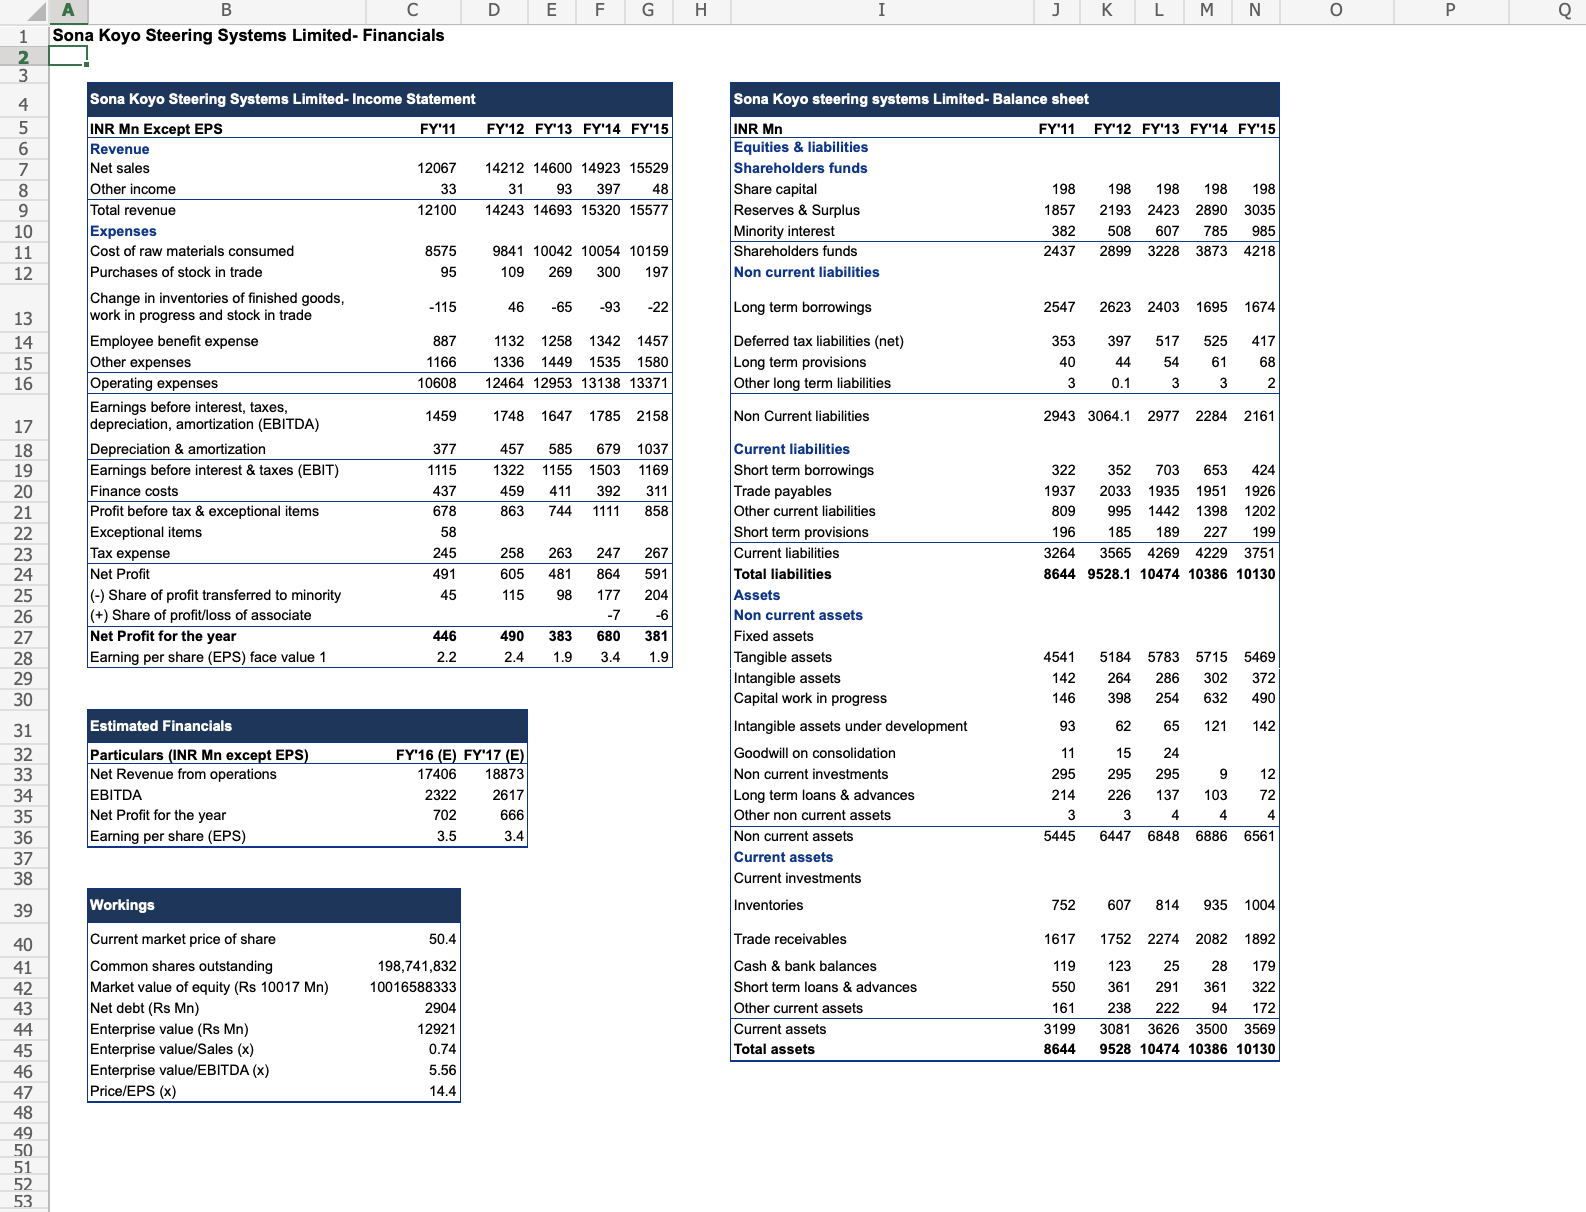
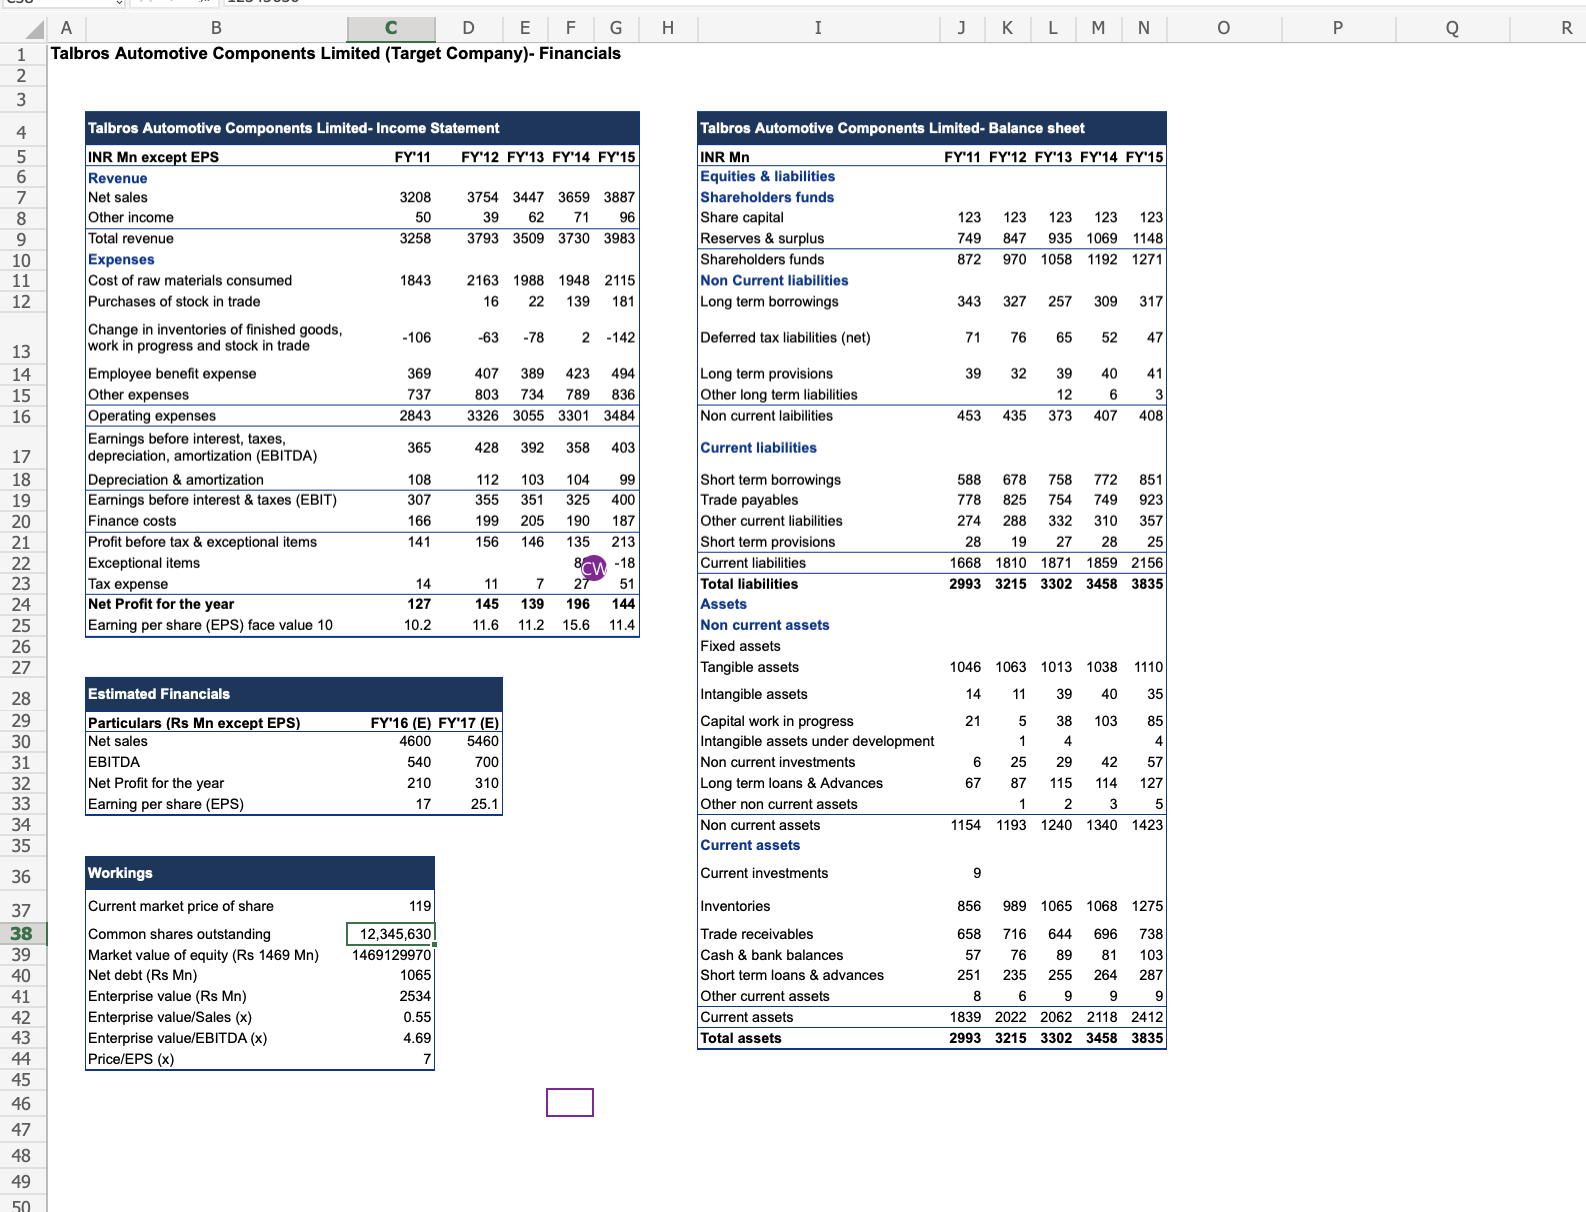
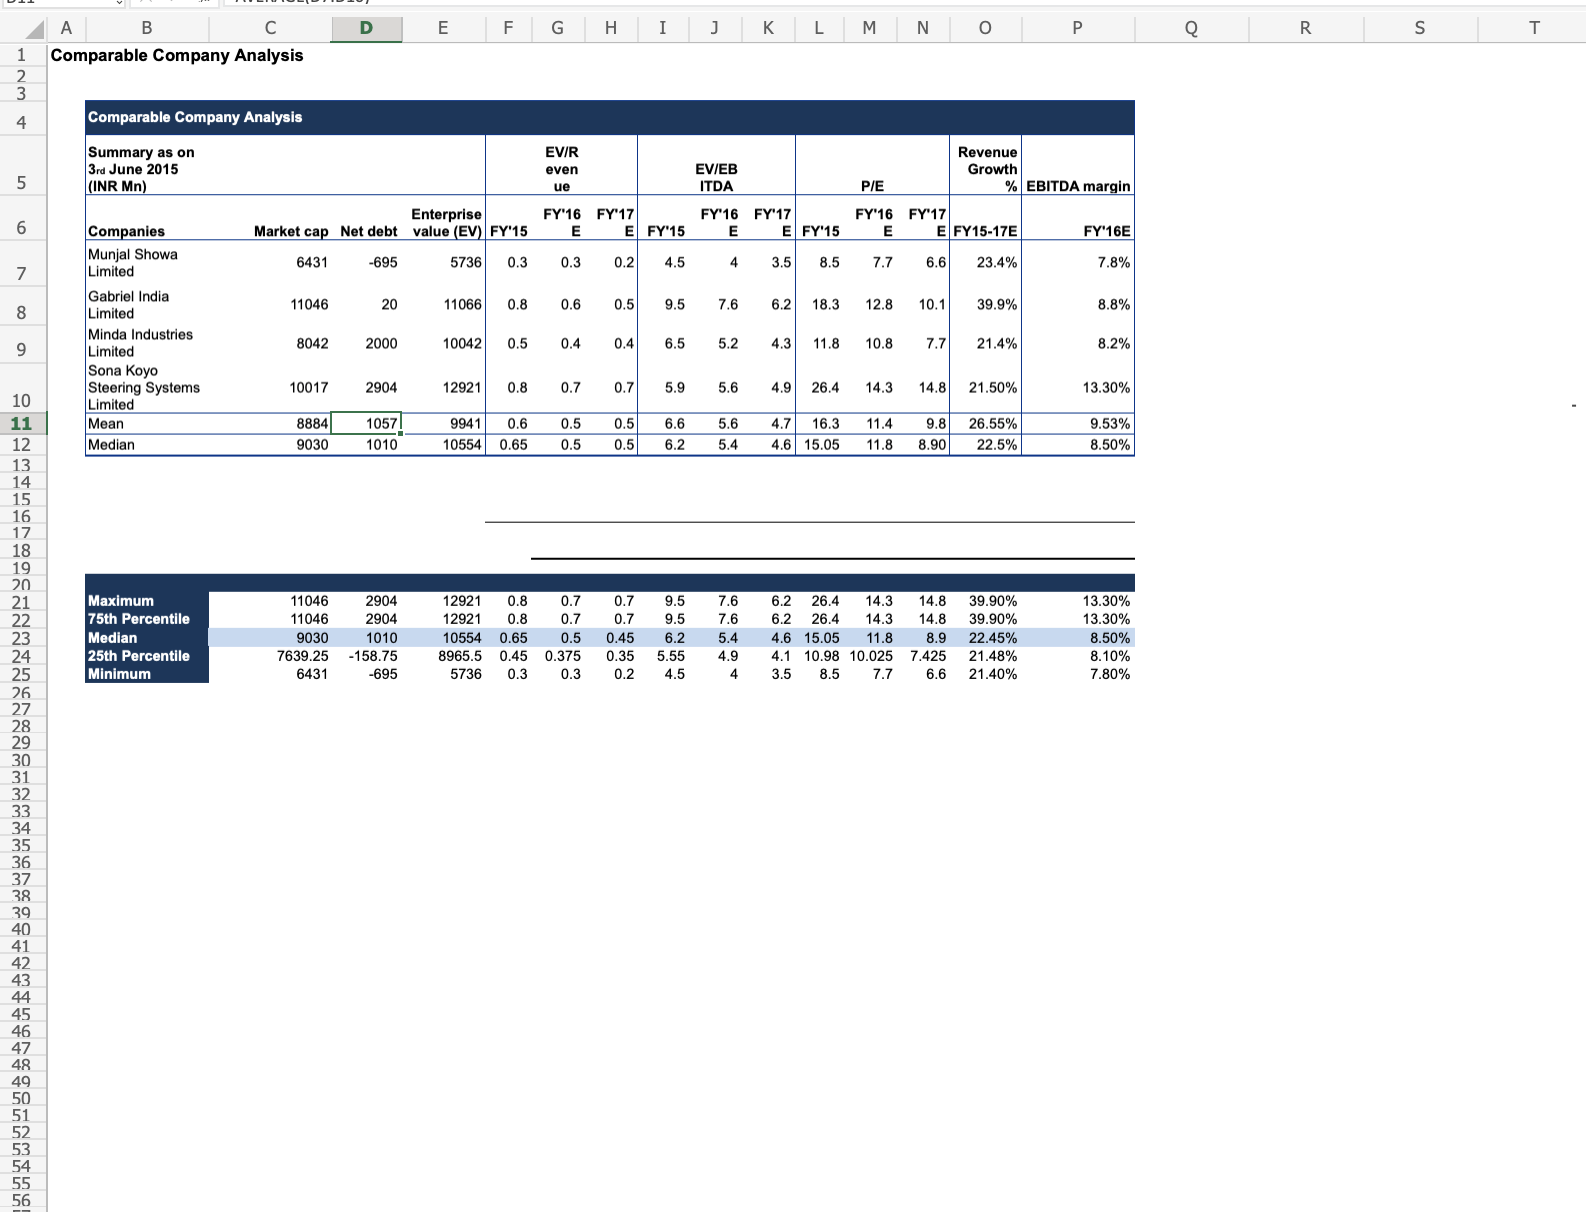
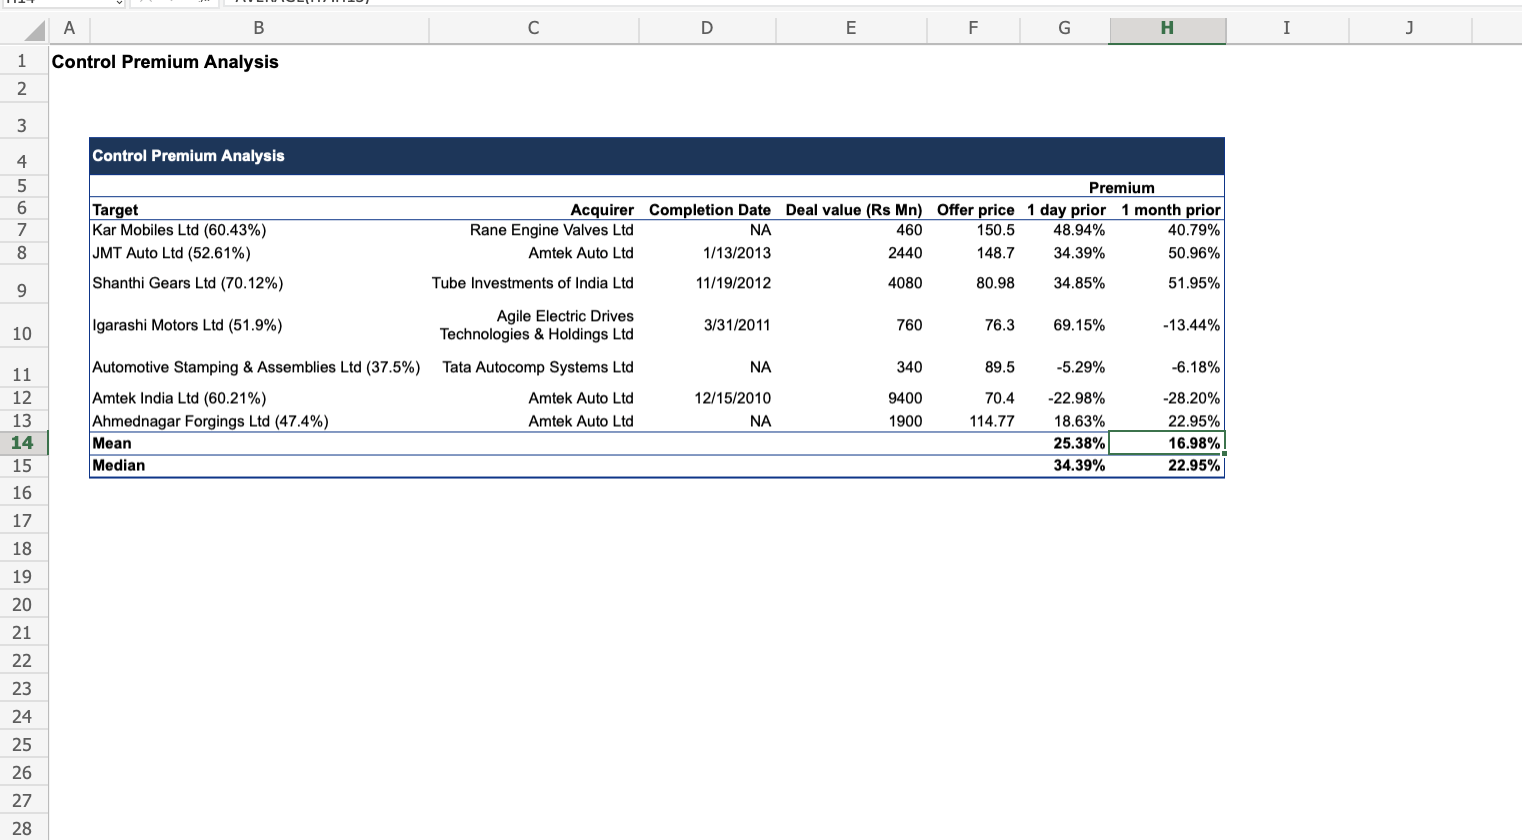
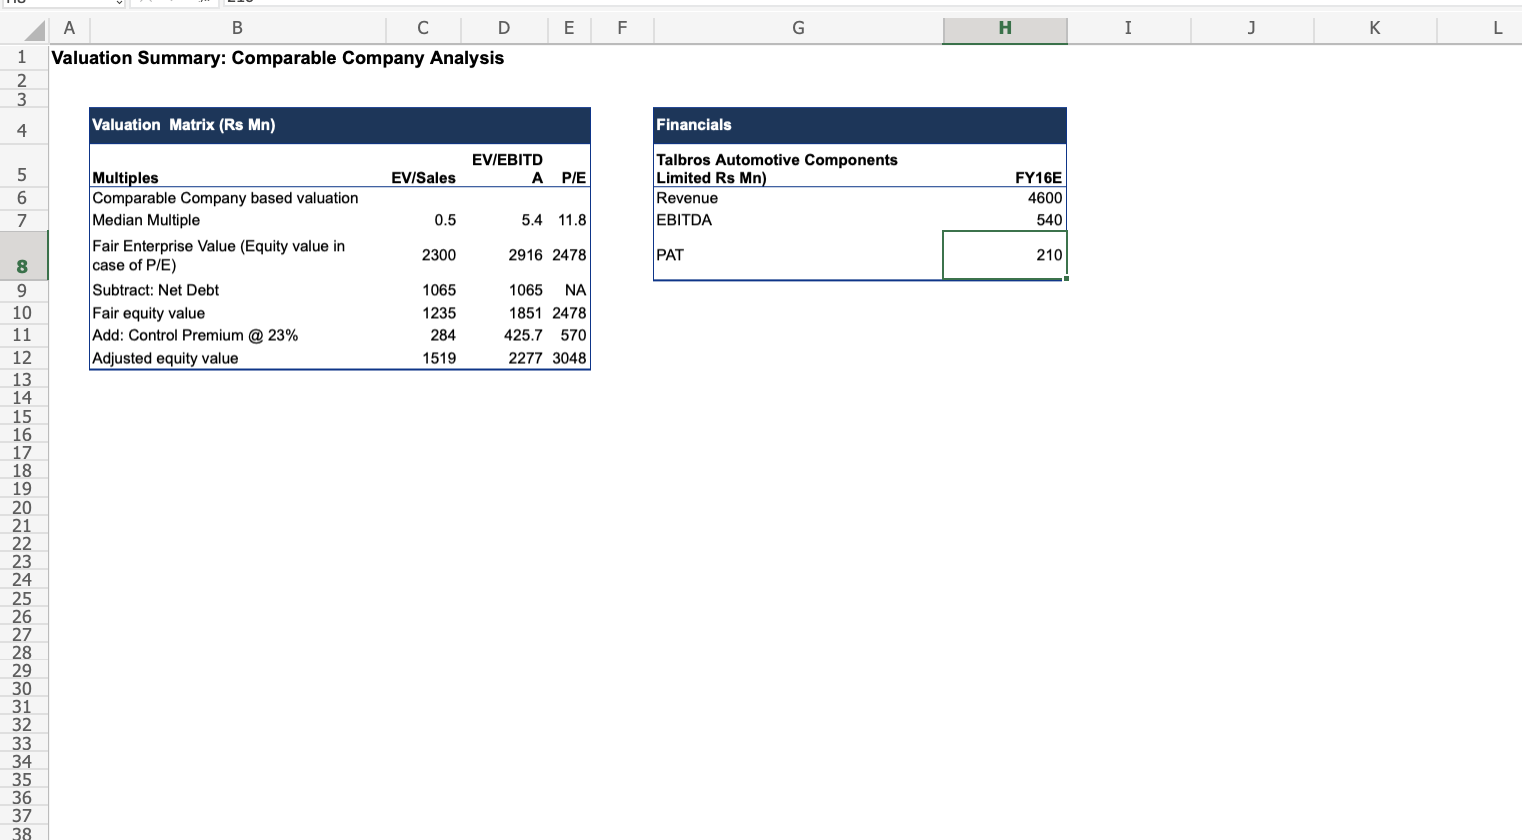
M N A B C D E F G H J K L Munjal Showa Limited- Financials Munjal Showa Limited- Income Statement Munjal Showa Limited- Balance Sheet INR Mn except EPS -Y'11 FY'12 FY'13 FY'14 FY'15 INR Mn "Y'11 FY'12 FY'13 FY'14 FY'15 Revenue Equities & liabilities Net sales 12893 15568 15814 15979 16429 Shareholders funds Other income 23 16 35 61 81 Share capita 79 79 79 79 79 Total revenue 12916 15584 15849 16040 16510 Reserves & Surplus 1949 2482 2948 3481 4027 10 Expenses Shareholders funds 2028 2561 3027 3560 4106 11 Cost of raw materials consumed 9698 11636 11765 11943 12144 Non current liabilities 0 12 Purchases of stock in trade 0 0 Long term borrowings 519 211 0 vilanys III IIIVCHILVIICS VI III IIIICU goods, work in progress and stock in 7 -46 22 -55 -25 Deferred tax liabilities (net) 139 142 142 118 85 13 trade 14 Employee benefit expense 547 665 766 880 924 Long term provisions 6 6 7 15 25 1831 2086 2208 2158 2120 Other long term liabilities 0 0 15 53 0 0 Other expenses 16 Operating expenses 12083 14341 14761 14926 15163 Non current liabilities 664 359 202 133 110 Earnings before interest, taxes, 810 1227 1053 1266 Current liabilities 17 depreciation, amortization (EBITDA) 54 200 18 Depreciation & amortization 262 272 276 284 286 Short term borrowings 19 Earnings before interest & taxes (EBIT) 571 971 812 830 1061 Trade payables 1637 1686 6 1508 1656 1552 20 Finance costs 91 112 72 27 Other current liabilities 378 393 391 158 106 21 480 859 740 803 1057 Short term provisions 188 182 191 234 252 Profit before tax & exceptional items 22 Exceptional items 0 -61 0 Current liabilities 2257 2461 2090 2048 1910 139 187 72 101 307 Total liabilities & equity 4949 5381 5319 5741 6126 23 Tax expense 24 Net Profit for the year 341 672 507 702 757 Assets 25 Earning per share (EPS) face value 2 8.5 16.7 15.1 17.4 18.9 Non current assets 0 0 26 Fixed assets 27 Tangible assets 2513 2427 2439 2309 2092 20 19 18 28 Estimated Financial Intangible assets 32 22 Capital work in progress 85 112 74 5 17 29 Particulars (Rs M FY'16 (E) FY'17 (E) 20283 Intangible assets under development 0 0 0 0 0 30 Net sales 18154 31 EBITDA 1422 1629 Non current investments 0 0 0 0 832 969 Long term loans & Advances 35 34 382 440 394 32 Net Profit for the year 33 Earning per share (EPS) 20.8 24.3 Other non current assets 8 2 0 34 Non current assets 2673 2597 2915 2774 2522 35 Current assets Current investments 30 200 300 680 36 Workings Current market price of share 160.8 6,431, 196,000.00 Inventories 367 491 399 493 665 37 Common shares outstanding 39,995,000 Trade receivables 1429 1759 1416 1768 2033 38 39 Market value of equity (Rs 6431 Mn) 6431196000 Cash & bank balances 31 47 179 155 15 Net debt (Rs Mn) -695 Short term loans & Advances 369 371 186 208 40 174 $736 Other current assets 80 86 24 44 38 41 Enterprise value (Rs Mn) 42 Enterprise value/Sales (x) 0.32 Current assets 2276 2784 2404 2968 3605 43 Enterprise value/EBITDA (x) Total assets 4949 5381 5319 5742 6127 44 Price/EPS (x) 7.7K C D E G H M N Gabriel India Limited- Financials W Gabriel India Limited- Income Statement Gabriel India Limited- Balance Sheet INR Mn except EPS FY'11 FY'12 FY'13 FY'14 FY'15 INR Mn FY'11 FY'12 FY'13 FY'14 FY'15 Equities & liabilities Revenue 9699 11282 12053 12866 14440 Shareholders funds Net sales Other income 93 74 40 56 43 Share capital 72 12 144 144 144 11356 12093 12922 14483 Reserves & surplus 1793 2240 2424 2708 3111 Total revenue 9792 Shareholders funds 1865 2312 2568 2852 3255 10 Expenses Cost of raw materials consumed 6949 8069 8689 9321 10319 Non current liabilities 11 100 Long term borrowings 562 246 164 96 12 Purchases of stock in trade 18 28 41 44 Change in inventories of finished 157 133 171 96 105 goods, work in progress and stock in 61 -24 .86 .99 12 Deferred tax liabilities (net) 13 trade 30 57 41 93 Employee benefit expense 700 794 910 982 1075 Long term provisions 53 14 Other expenses 1204 1495 1672 1713 1769 Other long term liabilities 36 15 256 16 Operating expenses 3810 10362 11226 11961 13275 Non current liabilities 772 409 368 233 Earnings before interest, taxes 889 920 827 905 1165 Current liabilities 17 depreciation, amortization (EBITDA) 270 Short term borrowings 678 662 497 469 18 Depreciation & amortization 219 276 272 317 1578 1907 Earnings before interest & taxes (EBIT 763 718 595 691 897 Trade payables 1467 1411 1391 19 401 468 557 454 411 20 Finance costs 171 170 122 89 55 Other current liabilities Profit before tax & exceptional items 592 548 473 602 842 Short term provisions 115 118 195 291 335 21 -17 77 .59 -42 -6 Current liabilities 2661 2659 2640 2792 2653 Exceptional items Total liabilities & equity 5298 5380 5576 5877 6164 23 Tax expense 122 93 30 131 235 24 Net Profit for the year 453 532 384 429 601 Assets 25 Earning per share (EPS) face value 1 6.3 7.4 2.6 2.9 4.2 Non current assets 26 Fixed assets Tangible assets 2024 2059 2498 2635 2655 27 Intangible assets 76 56 21 28 Estimated Financials 108 37 64 125 31 29 Particulars (Rs Mn except EPS) FY'16 (E) FY'17 (E) Capital work in progress 30 Net sales 17659 20211 Intangible assets under development 31 EBITDA 1462 1782 Non current investments 133 0.2 0.2 0.2 0.2 Long term loans & advances 114 377 298 232 226 32 Net Profit for the year 865 1091 24 33 Earning per share (EPS) 6 7.6 Other non current assets Non current assets 2755 2552.2 2916.2 3028.2 2957.2 34 35 Current assets Current investments 36 Workings Inventories 1017 1235 1112 1168 112 37 Current market price of share 76.9 Common shares outstanding 143,643,940 Trade receivables 943 1244 1215 1360 1723 38 Cash & bank balances 39 56 74 48 38 39 Market value of equity (Rs 11046 Mn) 11046218986 Short term loans & Advances 382 267 254 273 321 40 Net debt (Rs Mn) 20 162 26 5 0.2 41 Enterprise value (Rs Mn) 11066 Other current assets Current asset 2543 2828 2660 2849.2 3207 42 Enterprise value/Sales (x) 0.6 5298 5380 5576 5877 6164 43 Enterprise value/EBITDA (x) 7.6 Total assets 44 Price/EPS (x) 12.8 45 46 47C D E G H K M O Q R Minda Industries Limited- Financials 8 Minda Industries Limited- Income Statement Minda Industries Limited- Balance sheet INR Mn except EPS FY'11 FY'12 FY'13 FY'14 FY'15 INR Mn FY'11 FY'12 FY'13 FY'14 FY'15 Revenue Equities & liabilities Net sales 9542 11792 13404 17061 22266 Shareholders funds Other income 146 163 109 168 2 Share capital 565 194 194 194 194 10 Total revenue 9688 11955 13513 17229 22495 Reserves & surplus 1422 2668 2895 2920 3459 11 Expenses Minority interest 115 123 138 213 12 Cost of raw materials consumed 6446 8046 9493 9163 12357 Deferred revenue income 8 13 Purchases of stock in trade 2495 Shareholders funds 1987 2977 3212 3260 3866 Change in inventories of finished goods, work in progress and stock in -95 82 -112 -86 -75 Non current liabilities 14 trade 15 Employee benefit expense 1014 1343 1439 2248 2878 Long term borrowings 552 661 887 1376 972 16 Other expenses 1339 1562 1624 2323 3067 Deferred tax liabilities (net) 103 5 17 Operating expenses 8704 11033 12469 16282 20722 Long term provisions 74 157 176 237 264 Earnings before interest, taxes, 838 759 935 779 1544 Other long term liabilities 2 6 74 19 30 18 depreciation, amortization (EBITDA) 19 Depreciation & amortization 338 402 463 591 835 Non current liabilities 731 829 1137 1632 1266 20 Earnings before interest & taxes (EBIT] 646 520 581 356 938 Current liabilities 21 Finance costs 167 198 191 242 250 Short term borrowings 950 938 808 1402 1115 22 Profit before tax & exceptional items 479 322 390 114 688 Trade payables 1399 1773 2164 2473 2669 23 Exceptional items -76 2 15 159 Other current liabilities 448 551 633 935 894 24 Tax expense 122 3 109 76 194 Short term provisions 79 99 111 111 157 25 Net profit 357 243 283 53 653 Current liabilities 2876 3361 3716 4921 4835 26 (-) Share of profit transferred to minority 2 6 10 3 Total liabilities 5594 7167 8065 9813 9967 27 (+) Share of profit/loss of associate 42 -7 8 24 Assets 28 Net profit for the year 357 283 270 51 674 Non current assets 29 Earning per share (EPS) face value 10 26.1 17.7 17.7 45 42.8 Fixed assets 30 Tangible assets 2405 2654 3116 3928 4027 31 Intangible assets 98 92 69 77 85 32 Estimated Financial Capital work in progress 62 47 416 218 33 Particulars (Rs Mn except EPS) FY'16 (E) FY'17 (E) Intangible assets under development 7 6 0.7 34 Net sales 23546 27031 Non current investments 189 217 218 244 263 35 EBITDA 1919 2342 Deferred tax assets 14 16 36 Net Profit for the year 742 1086 Long term loans & advances 133 216 224 206 186 Earning per share (EPS) 16.9 65.8 Other non current assets 17 15 45 86 119 38 Non current assets 2911 3245 4108 4776 4774 39 Current asset 40 Workings Current investments 230 20 Current market price of share 07 Inventories 837 1963 895 41 1246 1406 42 Common shares outstanding 15,871,324 Trade receivables 1307 808 2173 2610 2895 43 Market value of equity (Rs 8042 Mn) 8042000000 Cash & bank balances 229 666 385 278 280 44 Net debt (Rs Mn) 2000 Short term loans & advances 301 446 466 198 544 45 Enterprise value (Rs Mn) 10042 Other current asset 28 38 75 48 46 Enterprise value/Sales 0.4 Current assets 2683 3922 3957 5037 5193 47 Enterprise value/EBITDA 5.2 Total assets 5594 7167 8065 9813 48 Price/EPS 10.8 49 50 51 57 53 54 55D E F G M N O Sona Koyo Steering Systems Limited- Financials WNH Sona Koyo Steering Systems Limited- Income Statement Sona Koyo steering systems Limited- Balance shee INR Mn Except EPS FY'11 FY'12 FY'13 FY'14 FY'15 INR Mn FY'11 FY'12 FY'13 FY'14 FY'15 Revenue Equities & liabilities DOO OUT Net sales 12067 14212 14600 14923 15529 Shareholders funds Other income 33 31 93 397 48 Share capital 198 198 198 198 198 Total revenue 12100 14243 14693 15320 15577 Reserves & Surplus 1857 2193 2423 2890 3035 10 Expenses Minority interest 382 508 607 785 985 11 Cost of raw materials consumed 8575 9841 10042 10054 10159 Shareholders funds 2437 2899 3228 3873 4218 12 Purchases of stock in trade 95 109 269 300 197 Non current liabilities Change in inventories of finished goods, -115 46 -65 -93 -22 Long term borrowings 2547 2623 2403 1695 1674 13 work in progress and stock in trade Employee benefit expense 887 1132 1258 1342 1457 Deferred tax liabilities (net) 353 397 517 525 417 14 54 68 15 Other expenses 1166 1336 1449 1535 1580 Long term provisions 10 44 16 Operating expenses 10608 12464 12953 13138 13371 Other long term liabilities 0.1 3 Earnings before interest, taxes, 1748 1647 1785 2158 Non Current liabilities 2943 3064.1 2977 2284 2161 17 depreciation, amortization (EBITDA) 1459 18 Depreciation & amortization 377 457 585 679 1037 Current liabilities 322 1155 1503 1169 Short term borrowings 322 352 703 653 424 19 Earnings before interest & taxes (EBIT) 1115 20 Finance costs 437 459 411 392 311 Trade payables 1937 2033 1935 1951 1926 21 Profit before tax & exceptional items 678 863 744 1111 858| Other current liabilities 809 995 1442 1398 1202 22 Exceptional items 58 Short term provisions 196 185 189 227 199 23 Tax expense 245 258 263 247 267 Current liabilities 3264 3565 4269 4229 3751 24 Net Profit 191 605 481 864 591 Total liabilities 8644 9528.1 10474 10386 10130 25 (-) Share of profit transferred to minority 45 115 177 204 Assets 26 (+) Share of profit/loss of associate -7 -6 Non current assets 27 Net Profit for the year 146 490 383 680 381 Fixed assets 28 Earning per share (EPS) face value 1 2.2 2.4 1.9 3.4 1.9 Tangible assets 4541 5184 5783 5715 5469 29 Intangible assets 142 264 286 302 372 Capital work in progress 146 398 254 632 490 30 Intangible assets under development 93 62 65 121 142 31 Estimated Financials 32 Particulars (INR Mn except EPS) FY'16 (E) FY'17 (E) Goodwill on consolidation 11 15 24 17406 18873 Non current investments 295 295 295 Net Revenue from operations 9 12 33 34 EBITDA 2322 2617 Long term loans & advances 214 226 137 103 72 35 Net Profit for the year 702 666 Other non current assets 36 Earning per share (EPS) 3.5 3.4 Non current assets 5445 6447 6848 6886 6561 37 Current assets 38 Current investments 752 935 1004 39 Workings Inventories 607 Current market price of share 50.4 Trade receivables 1617 1752 2274 2082 1892 40 41 Common shares outstanding 198,741,832 Cash & bank balances 119 123 25 28 179 291 361 42 Market value of equity (Rs 10017 Mn) 10016588333 Short term loans & advances 550 361 322 Other current asset 238 172 Net debt (Rs Mn) 2904 161 222 94 43 44 Enterprise value (Rs Mn) 12921 Current assets 3199 3081 3626 3500 3569 45 Enterprise value/Sales (x) 0.74 Total assets 8644 9528 10474 10386 10130 46 Enterprise value/EBITDA (x) 5.56 47 Price/EPS (x) 14.4 48 49 50 52 53O Q A H P R B C D E F G K LMN Talbros Automotive Components Limited (Target Company)- Financials WNH Talbros Automotive Components Limited- Income Statement Talbros Automotive Components Limited- Balance sheet INR Mn except EPS FY'11 FY'12 FY'13 FY'14 FY'15 INR Mn FY'11 FY'12 FY'13 FY'14 FY'15 Revenue Equities & liabilities Net sales 3208 3754 3447 3659 3887 Shareholders funds 123 123 123 123 123 Other income 50 39 62 71 96 Share capital Total revenue 3258 3793 3509 3730 3983 Reserves & surplus 749 847 935 1069 1148 372 970 1058 1192 1271 10 Expenses Shareholders funds 11 Cost of raw materials consumed 1843 2163 1988 1948 2115 Non Current liabilities 17 Purchases of stock in trade 16 22 139 181 Long term borrowings 343 327 257 317 Change in inventories of finished goods, -106 63 -78 2 -142 Deferred tax liabilities (net) 71 76 65 52 47 13 work in progress and stock in trad 39 32 40 41 14 Employee benefit expense 369 107 389 423 494 Long term provisions 15 Other expenses 737 803 734 789 836 Other long term liabilities 6 3 407 16 Operating expenses 2843 3326 3055 3301 3484 Non current laibilities 453 435 373 408 Earnings before interest, taxes, 365 428 392 358 403 Current liabilities 17 depreciation, amortization (EBITDA) Depreciation & amortization 108 112 103 104 99 Short term borrowings 588 678 758 772 851 18 19 Earnings before interest & taxes (EBIT) 307 355 351 325 400 Trade payables 778 825 754 749 923 20 Finance costs 166 199 205 190 187 Other current liabilities 274 288 332 310 357 21 Profit before tax & exceptional items 141 156 146 135 213 Short term provisions 28 19 27 28 25 22 Current liabilities 1668 1810 1871 1859 2156 Exceptional items BCW - 18 23 Tax expense 14 11 51 Total liabilities 2993 3215 3302 3458 3835 24 Net Profit for the year 127 145 139 196 144 Assets 25 Earning per share (EPS) face value 10 10.2 11.6 11.2 15.6 11.4 Non current assets 26 Fixed assets Tangible assets 1046 1063 1013 1038 1110 27 14 40 35 Estimated Financials Intangible assets 11 39 28 Capital work in progress 21 5 38 102 85 29 Particulars (Rs Mn except EPS) FY'16 (E) FY'17 (E) 30 Net sales 4600 5460 Intangible assets under development 1 4 Non current investm 25 42 57 31 EBITDA 540 700 Long term loans & Advances 37 87 210 310 115 114 127 32 Net Profit for the year 2 3 33 Earning per share (EPS) 17 25.1 Other non current assets 5 34 Non current asset 1154 1193 1240 1340 1423 35 Current assets Working Current investments 36 856 989 1065 1068 1275 37 Current market price of share 19 Inventories 38 Common shares outstanding 12,345,630 Trade receivables 716 644 696 738 1469129970 Cash & bank balances 57 76 89 81 103 39 Market value of equity (Rs 1469 Mn) 235 255 264 287 40 Net debt (Rs Mn) 1065 Short term loans & advances 251 2534 Other current assets 6 9 g 9 41 Enterprise value (Rs Mn) 42 Enterprise value/Sales (x) 0.55 Current asset 1839 2022 2062 2118 2412 43 Enterprise value/EBITDA (x) 4.69 Total asset 2993 3215 3302 3458 3835 44 Price/EPS (x) 45 46 47 48 49H L M O P Q R S T A B D E F G I J K N Comparable Company Analysis AWNI Comparable Com EV/R Revenue Summary as on 3rd June 2015 ever EV/EB Growth 5 (INR Mn) ue ITDA P/E % EBITDA margin Enterprise FY'16 FY'17 FY'16 FY'17 FY'16 FY'17 FY'16E 6 Companies Market cap Net debt value (EV) FY'15 E E FY'15 E E FY'15 E E FY15-17E |Munjal Showa 6431 -695 5736 0.3 0.3 0.2 4.5 4 3.5 8.5 7.7 6.6 23.4% 7.8% Limited 8.8% Gabriel India 20 0.8 9.5 7.6 6.2 18.3 12.8 10.1 39.9 11046 11066 0.6 Co Limited 4.3 11.8 10.8 7.7 21.49 8.2% Minda Industries 8042 2000 10042 0.4 0.4 6.5 5.2 Limited Sona Koyo 13.30% Steering Systems 10017 2904 12921 0.8 07 D.7 5.9 5.6 4.9 26.4 14.3 14.8 21.50% 10 Limited 11 8884 1057 9941 0.6 0.5 0.5 6.6 5.6 4.7 16.3 11.4 9.8 26.55% 9.53% Mean 22.5% 8.50% 12 Median 9030 1010 10554 0.65 0.5 0.5 6.2 5.4 4.6 15.05 11.8 8.90 13 14 20 13.30% 21 Maximum 11046 2904 12921 0.8 39.90% 0.7 0.7 9.5 7.6 5.2 26.4 14.3 14.8 2904 12921 0.8 0.7 0.7 9.5 7.6 6.2 26.4 14.3 14.8 39.90% 13.30% 22 75th Percentile 11046 6.2 5.4 4.6 15.05 8.9 22.45% 8.50% 23 Median 9030 1010 10554 0.5 0.45 8.10% 24 25th Percentile 7639.25 -158.75 8965.5 0.45 0.375 0.35 5.55 4.9 4.1 10.98 10.025 7.425 21.48% 5736 0.3 0.3 0.2 15 A 3.5 8.5 7.7 6.6 21.40% 7.80% 25 Minimum 6431 -695 26 27 28 29 30 31 33 34 36 37 39 40 42 43 44 45 46 48A B C D E F G H I J 1 Control Premium Analysis 2 3 Control Premium Analysis UI A Premium Target Acquirer Completion Date Deal value (Rs Mn) Offer price 1 day prior 1 month prior Kar Mobiles Ltd (60.43%) Rane Engine Valves Ltd NA 460 150.5 48.94% 40.79% 8 JMT Auto Ltd (52.61%) Amtek Auto Ltd 1/13/2013 2440 148.7 34.39% 50.96% 9 Shanthi Gears Ltd (70.12%) Tube Investments of India Ltd 11/19/2012 4080 80.98 34.85% 51.95% Igarashi Motors Ltd (51.9%) Agile Electric Drives 10 Technologies & Holdings Ltd 3/31/2011 760 76.3 69.15% -13.44% 11 Automotive Stamping & Assemblies Lid (37.5%) Tata Autocomp Systems Ltd NA 340 89.5 -5.29% -6.18% 12 Amtek India Ltd (60.21%) Amtek Auto Ltd 12/15/2010 9400 70.4 -22.98% -28.20% 13 Ahmednagar Forgings Ltd (47.4%) Amtek Auto Ltd NA 1900 114.77 18.63% 22.95% 14 Mean 25.38% 16.98% 15 Median 34.39% 22.95% 16 17 18 19 20 21 22 23 24 25 26 27 28A C D E F G H I J K L B Valuation Summary: Comparable Company Analysis WN E 4 Valuation Matrix (Rs Mn) Financials EV/EBITD Talbros Automotive Components Multiples EV/Sales A P/E Limited Rs Mn) FY16E Revenue 4600 Comparable Company based valuation 0.5 5.4 11.8 EBITDA 540 Median Multiple Fair Enterprise Value (Equity value in 2300 2916 2478 PAT 210 case of P/E) 9 Subtract: Net Debt 1065 1065 NA 10 Fair equity value 1235 1851 2478 11 Add: Control Premium @ 23% 284 425.7 570 12 Adjusted equity value 1519 2277 3048 13 14 15 16 17 18 19 20 21 22 23 24 25 26 30 AWNIA B C D E F G H I J K L M 1 Comparable Transaction Analysis 2 3 Comparable Transaction Analysis Ann. Date Compl. Date Target Bidder Deal Value Enterprise Year 1 Revenue EV/Revenue EV/EBITDA Multiple PE JOUIA Company Company INR(Mn) Value Ending Date INR(Mn) Multiple Multiple INR(Mn) 5/20/2014 Kar Mobiles Limited (60.43% 456 Stake) Rane Engine Valve Limited 589.2 3/31/2014 1201.7 0.49 7.01 24.47 8 10/3/2013 JMT Auto Limited (52.61% Amtek Auto Limited 2439 3453.2 9 6/27/2013 Stake) 3/31/2013 3350.2 1.03 6.17 18.07 8/3/2012 Mag Engineering Private 8/3/2012 Limited Sandhar Technologies Limited 700 700 3/31/2012 652.3 1.07 4.78 NA 10 7/13/2012 11/19/2012 Stake) Shanthi Gears Limited (70.12% Tube Investments of India Limited 4081 6058.2 3/31/2012 1730.1 3.5 8.74 23.54 11 Trinity India Limited (78% 12 1/5/2012 2/23/2012 Stake) Ring Plus Aqua Ltd. 741 893.2 3/31/2011 843.9 1.06 9.88 117.81 12/10/2010 3/31/2011 garashi Motors India Limited Agile Electric Drives Technologies 776 1523.4 3/31/2010 1592.4 0.96 8.12 38.73 13 (51.9% Stake) and Holdings Private Limited 8/1/2008 12/15/2010 Amtek India Limited (60.21% 6.15 14 Stake) Amtek Auto Limited 9402 13,188.80 6/30/2008 13, 189.10 2.56 7/31/2008 Ahmednagar Forgings Ltd (47.4% Stake Amtek Auto Limited 1900 5025.5 6/30/2008 6610.6 0.76 4.5 6.66 15 16 Mean 1.23 6.47 33.63 17 Median 1.02 6.59 23.54 18 19 20 21 22 23m Case Analysis 1. Afull, complete excel model using the provided excel document. 2. An executive summary Excel Model Do not hardcode numbers. Please use formulas wherever possible. Executive Summa ry The executive summary should include the following: 1. A very brief overview of the company/situation 2. questions: What are the advantages and disadvantages of comparable company analysis versus comparable transaction analysis? Wis the use of various multiples in valuation? What factors affect the choice of one multiple over another when selecting multiple for a firm? How is DCF different from multiple valuation, and why will an analyst prefer one method over the other? How do we choose comparable firms and comparable transactions for valuation in this case? Calculate the value ofm using multiples, comparable company analysis and comparable transaction analysis. Summarize and compare the results. i. Which method do you believe results in a more accurate valuation and why