

Question: M Your answer is ready - Ipearl( * * Course Hero X Home X 121 4-1 Participation Activities: N X zy Section 4.2 - MAT
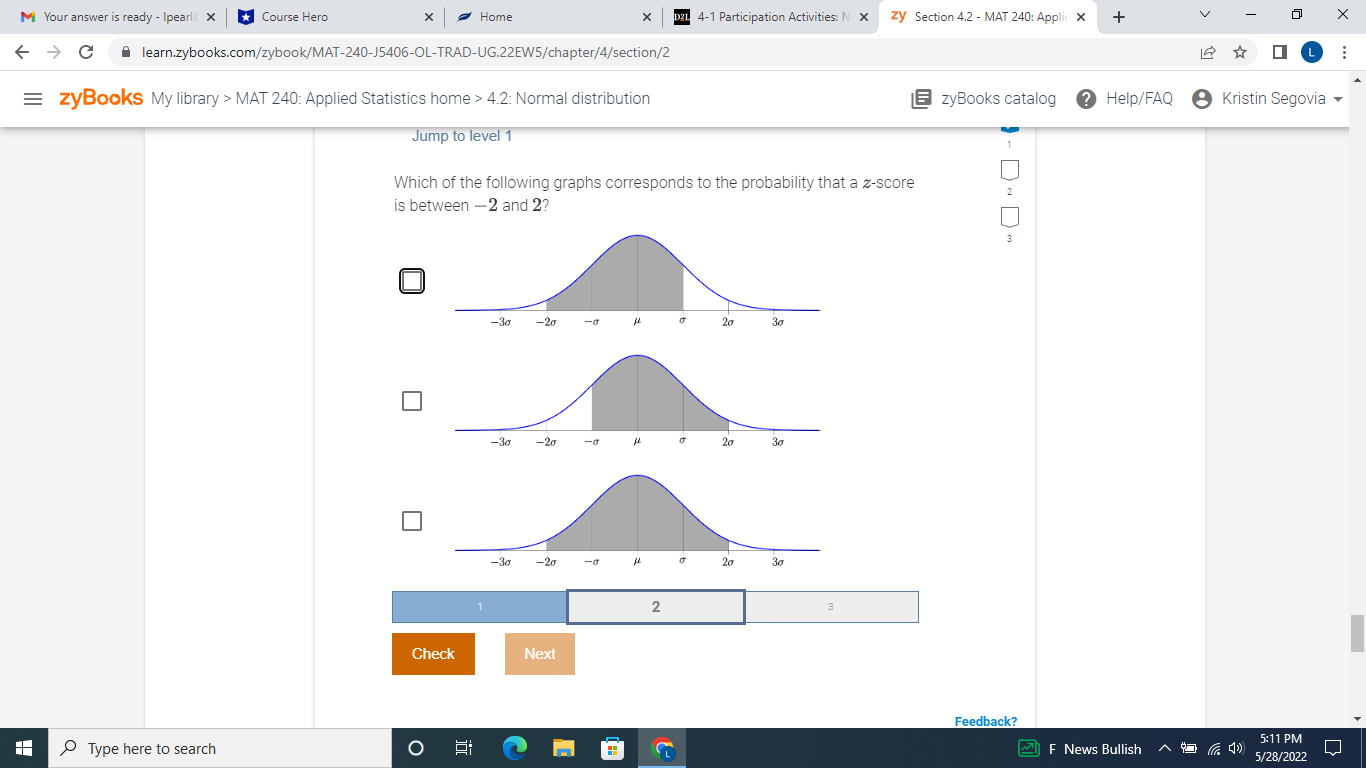

M Your answer is ready - Ipearl( * * Course Hero X Home X 121 4-1 Participation Activities: N X zy Section 4.2 - MAT 240: Applie X + V X C A learn.zybooks.com/zybook/MAT-240-J5406-OL-TRAD-UG.22EW5/chapter/4/section/2 ... = zyBooks My library > MAT 240: Applied Statistics home > 4.2: Normal distribution zyBooks catalog Help/FAQ Kristin Segovia Jump to level 1 Which of the following graphs corresponds to the probability that a z-score is between -2 and 2? O -20 20 0 -30 -20 -g 20 30 0 -30 -20 20 30 2 3 Check Next Feedback? Type here to search O M F News Bullish ~ (7 () 5:11 PM 5/28/2022
Step by Step Solution
There are 3 Steps involved in it
1 Expert Approved Answer
Step: 1 Unlock

Question Has Been Solved by an Expert!
Get step-by-step solutions from verified subject matter experts
Step: 2 Unlock
Step: 3 Unlock