

Question: M143 Week 4 Worksheet Worksheet Assignment Cubic Regression Directions: These activity questions are written to follow the activity for the week. After the weekly lecture
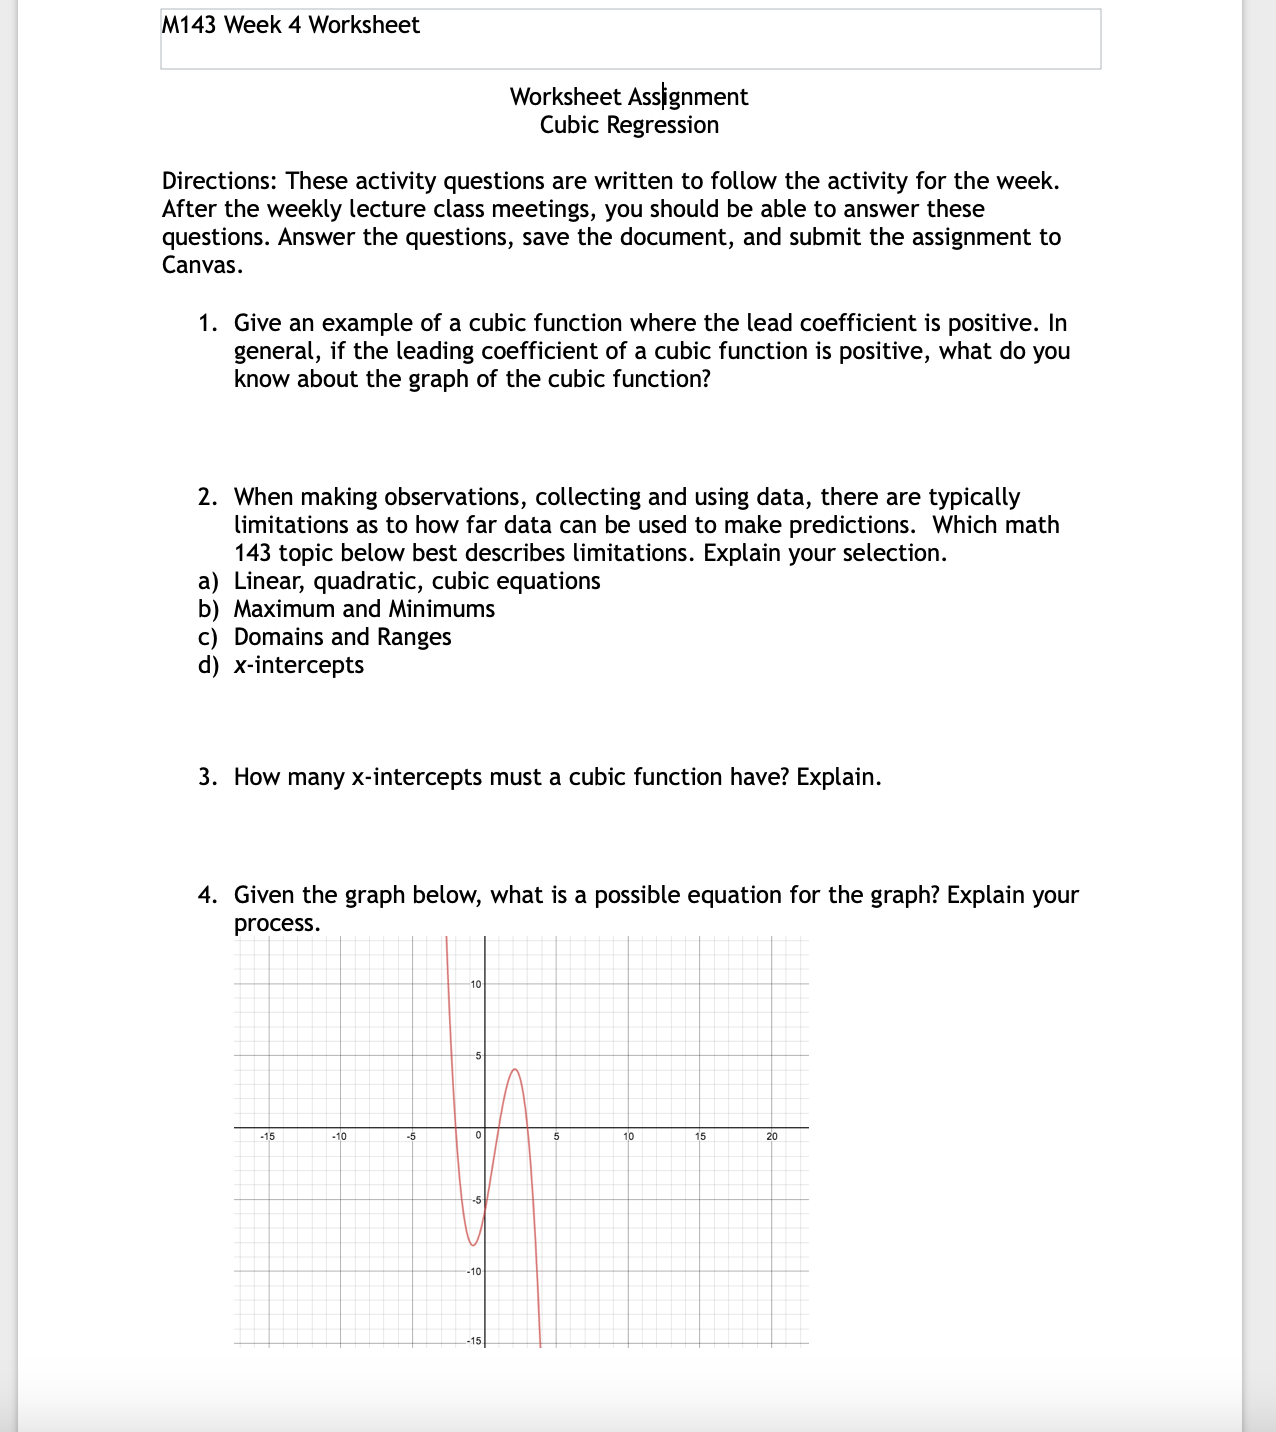
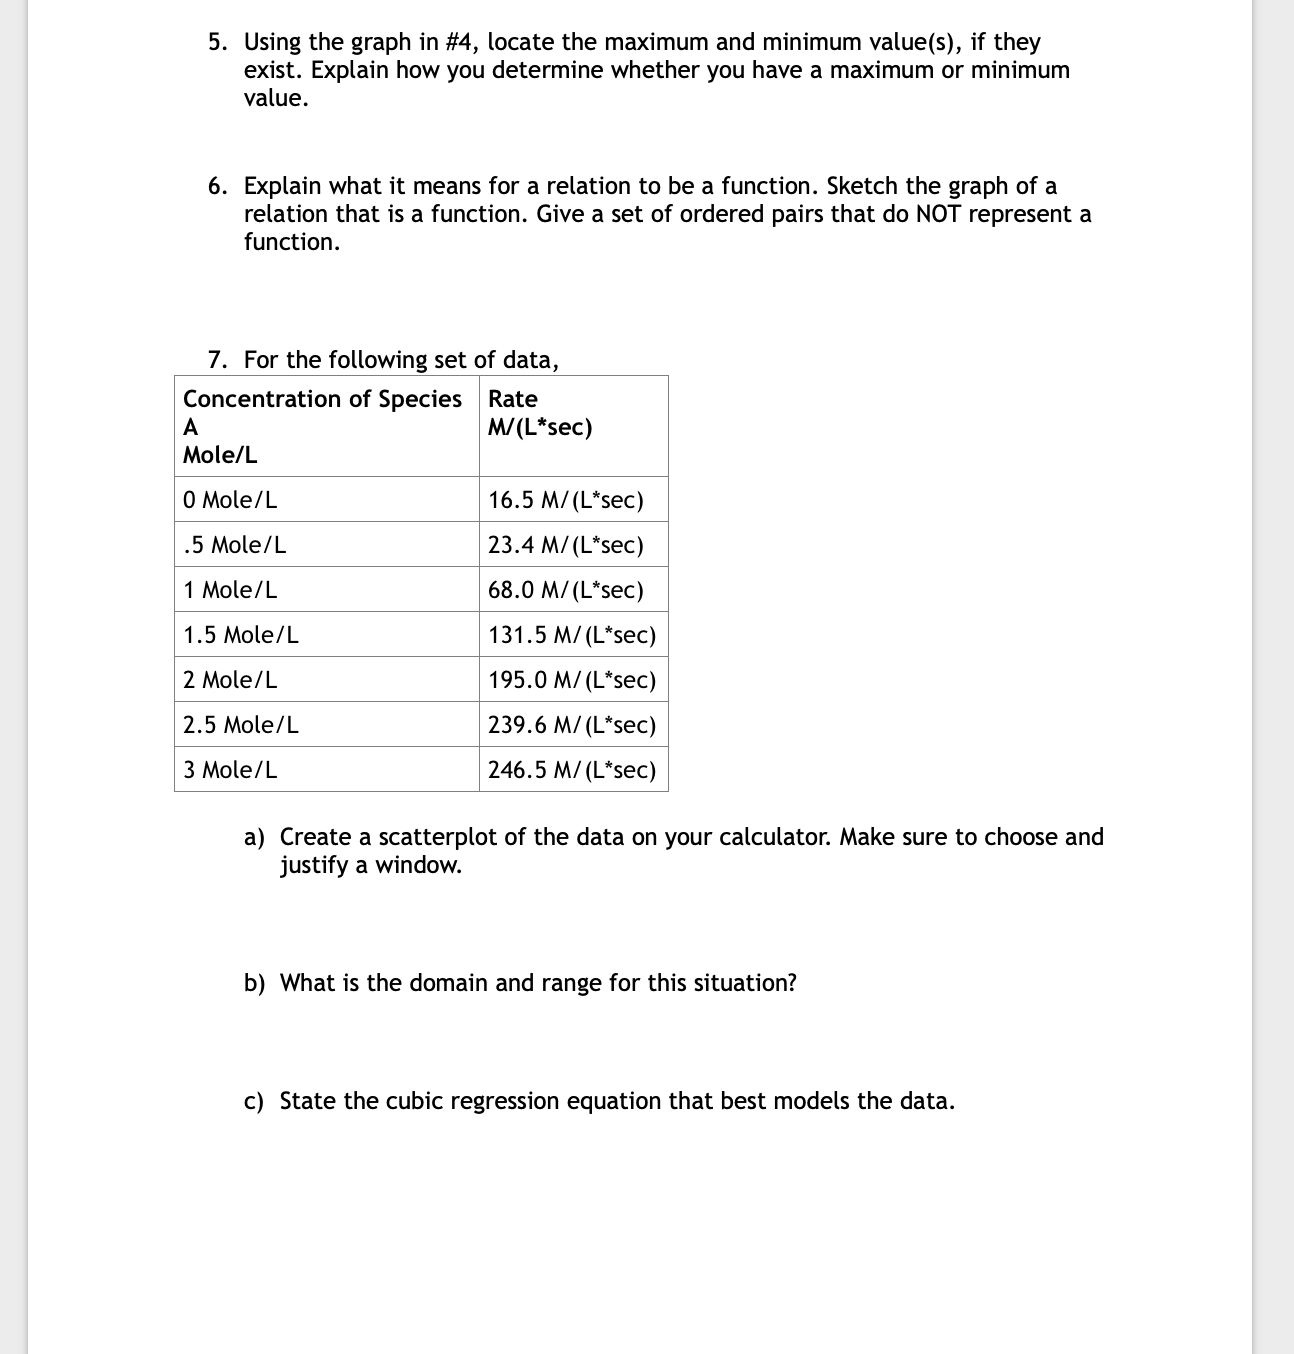
M143 Week 4 Worksheet Worksheet Assignment Cubic Regression Directions: These activity questions are written to follow the activity for the week. After the weekly lecture class meetings, you should be able to answer these questions. Answer the questions, save the document, and submit the assignment to Canvas. 1. Give an example of a cubic function where the lead coefficient is positive. In general, if the leading coefficient of a cubic function is positive, what do you know about the graph of the cubic function? 2. When making observations, collecting and using data, there are typically limitations as to how far data can be used to make predictions. Which math 143 topic below best describes limitations. Explain your selection. a) Linear, quadratic, cubic equations b) Maximum and Minimums ) Domains and Ranges d) x-intercepts 3. How many x-intercepts must a cubic function have? Explain. 4. Given the graph below, what is a possible equation for the graph? Explain your process. 5. Using the graph in #4, locate the maximum and minimum value(s), if they exist. Explain how you determine whether you have a maximum or minimum value. 6. Explain what it means for a relation to be a function. Sketch the graph of a relation that is a function. Give a set of ordered pairs that do NOT represent a function. 7. For the following set of data, Concentration of Species | Rate A M/ (L*sec) Mole/L 0 Mole/L 16.5 M/ (L*sec) .5 Mole/L 23.4 M/ (L*sec) 1 Mole/L 68.0 M/(L*sec) 1.5 Mole/L 131.5 M/ (L*sec) 2 Mole/L 195.0 M/ (L*sec) 2.5 Mole/L 239.6 M/ (L*sec) 3 Mole/L 246.5 M/ (L*sec) a) Create a scatterplot of the data on your calculator. Make sure to choose and justify a window. b) What is the domain and range for this situation? c) State the cubic regression equation that best models the data. M143 Week 4 Worksheet d) Discuss why a cubic equation fits the data best. e) Describe the intervals on the model where the graph is increasing and the intervals on the model where the graph is decreasing
Step by Step Solution
There are 3 Steps involved in it

Get step-by-step solutions from verified subject matter experts