

Question: M3.4 Name that Event Evaluate Being able to draw probability conclusions from data is important. This data has a great deal of information. For
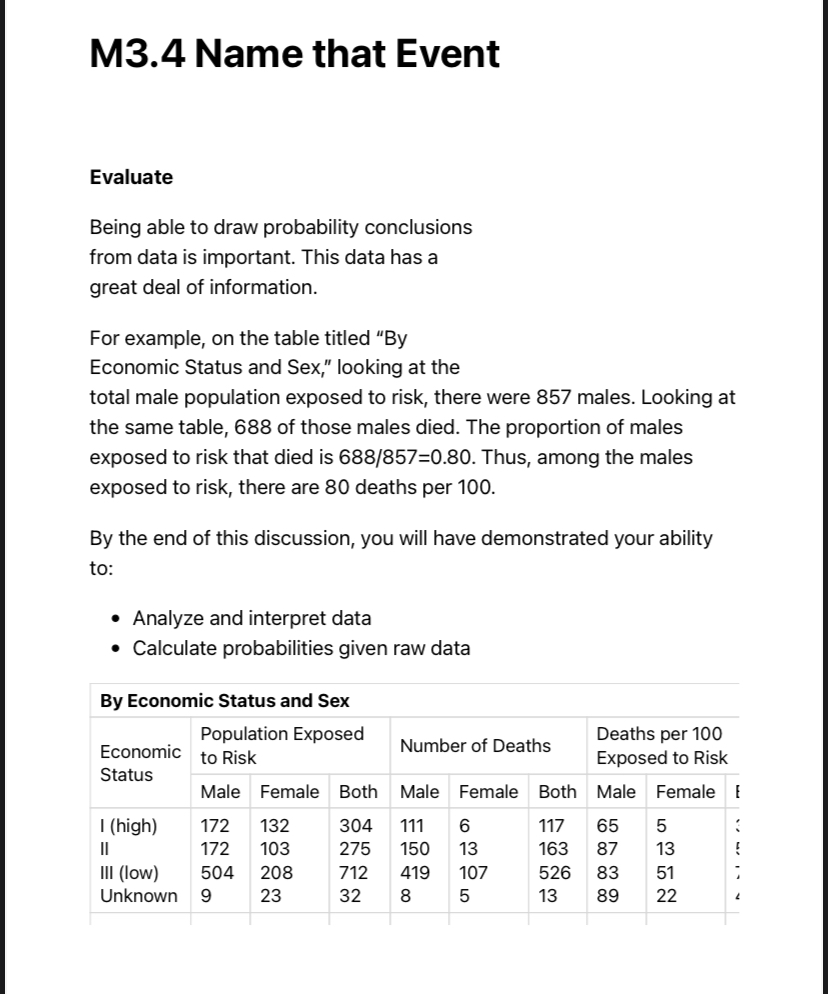
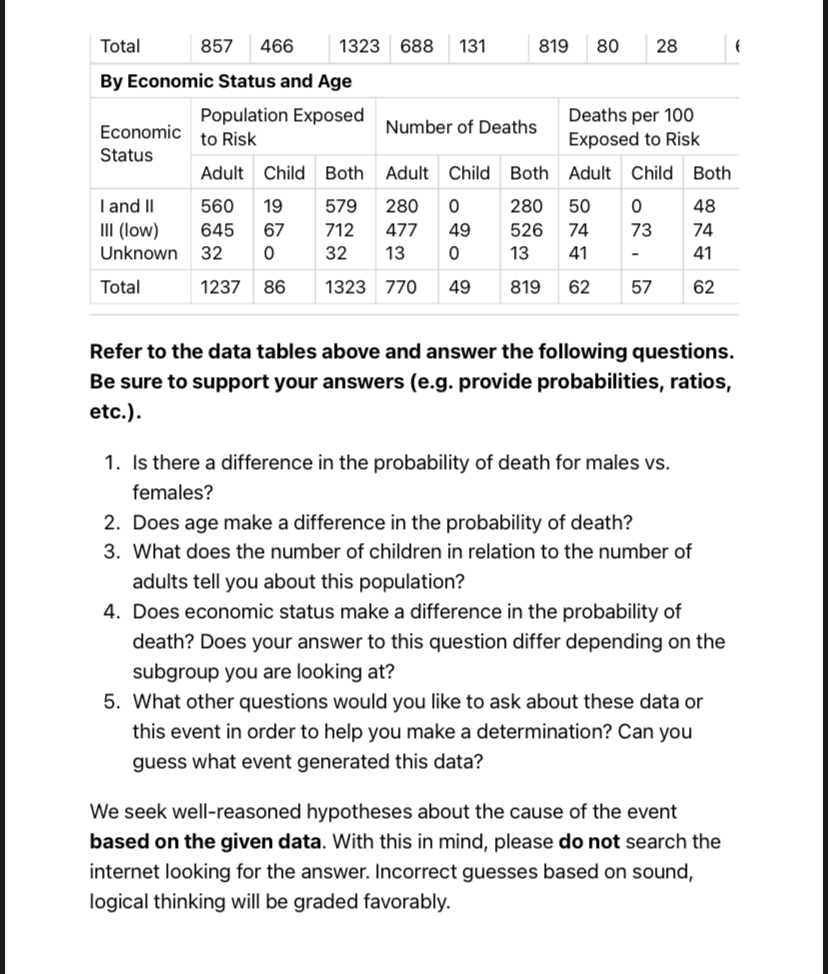
M3.4 Name that Event Evaluate Being able to draw probability conclusions from data is important. This data has a great deal of information. For example, on the table titled "By Economic Status and Sex," looking at the total male population exposed to risk, there were 857 males. Looking at the same table, 688 of those males died. The proportion of males exposed to risk that died is 688/857=0.80. Thus, among the males exposed to risk, there are 80 deaths per 100. By the end of this discussion, you will have demonstrated your ability to: Analyze and interpret data Calculate probabilities given raw data By Economic Status and Sex Population Exposed Deaths per 100 Number of Deaths Economic to Risk Exposed to Risk Status Male Female Both Male Female Both Male Female E I (high) 172 132 304 111 6 117 65 5 || 172 103 275 150 13 163 87 13 E III (low) 504 208 712 419 107 526 83 51 Unknown 9 23 32 8 5 13 89 22 1323 688 131 819 80 28 Total 857 466 By Economic Status and Age Economic Population Exposed to Risk Number of Deaths Deaths per 100 Exposed to Risk Status Adult Child Both Adult Child Both Adult Child Both I and II 560 19 III (low) 645 67 Unknown 32 Total 1237 86 $ 579 280 0 280 50 0 48 712 477 49 526 74 73 74 32 13 0 13 41 1323 770 49 819 62 552 57 41 62 Refer to the data tables above and answer the following questions. Be sure to support your answers (e.g. provide probabilities, ratios, etc.). 1. Is there a difference in the probability of death for males vs. females? 2. Does age make a difference in the probability of death? 3. What does the number of children in relation to the number of adults tell you about this population? 4. Does economic status make a difference in the probability of death? Does your answer to this question differ depending on the subgroup you are looking at? 5. What other questions would you like to ask about these data or this event in order to help you make a determination? Can you guess what event generated this data? We seek well-reasoned hypotheses about the cause of the event based on the given data. With this in mind, please do not search the internet looking for the answer. Incorrect guesses based on sound, logical thinking will be graded favorably.
Step by Step Solution
There are 3 Steps involved in it

Get step-by-step solutions from verified subject matter experts