

Question: MA 203DL Excel Project 8 Correlation and Regression Questions are taken from Elementary Statistics using Excel, 6 th Edition, Mario Triola, practice problems from sections


MA 203DL Excel Project 8
Correlation and Regression Questions are taken from "Elementary Statistics using Excel, 6th Edition", Mario Triola, practice problems from sections 10-1 and 10-2 1)
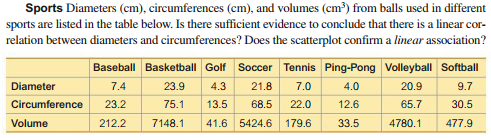

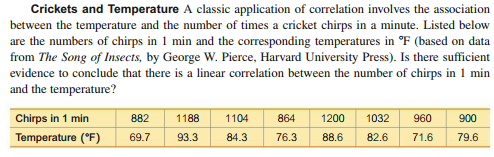

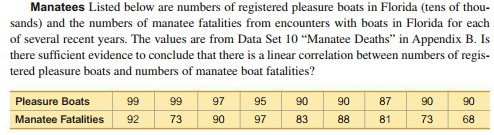
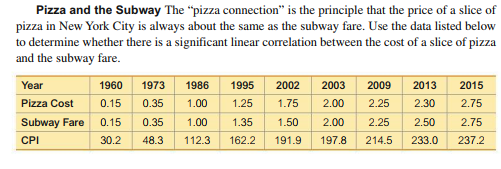
Sports Diameters (cm), circumferences (cm), and volumes (cm') from balls used in different sports are listed in the table below. Is there sufficient evidence to conclude that there is a linear cor- relation between diameters and circumferences? Does the scatterplot confirm a linear association? Baseball Basketball Golf Soccer Tennis Ping-Pong Volleyball Softball Diameter 7.4 23.9 4.3 21.8 7.0 4.0 20.9 9.7 Circumference 23.2 75.1 13.5 68.5 22.0 12.6 65.7 30.5 Volume 212.2 7148.1 41.6 5424.6 179.6 33.5 4780.1 477.9Pizza and the Subway The "pizza connection" is the principle that the price of a slice of pizza in New York City is always about the same as the subway fare. Use the data listed below to determine whether there is a significant linear correlation between the cost of a slice of pizza and the subway fare. Year 1960 1973 1986 1995 2002 2003 2009 2013 2015 Pizza Cost 0.15 0.35 1.00 1.25 1.75 2.00 2.25 2.30 2.75 Subway Fare 0.15 0.35 1.00 1.35 1.50 2.00 2.25 2.50 2.75 CPI 30.2 48.3 112.3 162.2 191.9 197.8 214.5 233.0 237.2Crickets and Temperature A classic application of correlation involves the association between the temperature and the number of times a cricket chirps in a minute. Listed below are the numbers of chirps in 1 min and the corresponding temperatures in "F (based on data from The Song of Insects, by George W. Pierce, Harvard University Press). Is there sufficient evidence to conclude that there is a linear correlation between the number of chirps in 1 min and the temperature? Chirps in 1 min 882 1188 1104 864 1200 1032 960 900 Temperature ('F) 69.7 93.3 84.3 76.3 88.6 82.6 71.6 79.6Sports Diameters (cm), circumferences (cm), and volumes (cm') from balls used in different sports are listed in the table below. Is there sufficient evidence to conclude that there is a linear cor- relation between diameters and circumferences? Does the scatterplot confirm a linear association? Baseball Basketball Golf Soccer Tennis Ping-Pong Volleyball Softball Diameter 7.4 23.9 4.3 21.8 7.0 4.0 20.9 9.7 Circumference 23.2 75.1 13.5 68.5 22.0 12.6 65.7 30.5 Volume 212.2 7148.1 41.6 5424.6 179.6 33.5 4780.1 477.9Manatees Listed below are numbers of registered pleasure boats in Florida (tens of thou- sands) and the numbers of manatee fatalities from encounters with boats in Florida for each of several recent years. The values are from Data Set 10 "Manatee Deaths" in Appendix B. Is there sufficient evidence to conclude that there is a linear correlation between numbers of regis- tered pleasure boats and numbers of manatee boat fatalities? Pleasure Boats 99 99 97 95 90 90 87 90 90 Manatee Fatalities 92 73 90 97 83 88 81 73 68
Step by Step Solution
There are 3 Steps involved in it

Get step-by-step solutions from verified subject matter experts