

Question: Mac Analyze Apple Inc. by segment Segment disclosure by Apple Inc. (AAPL) provides sales information for its major product lines for three recent years as
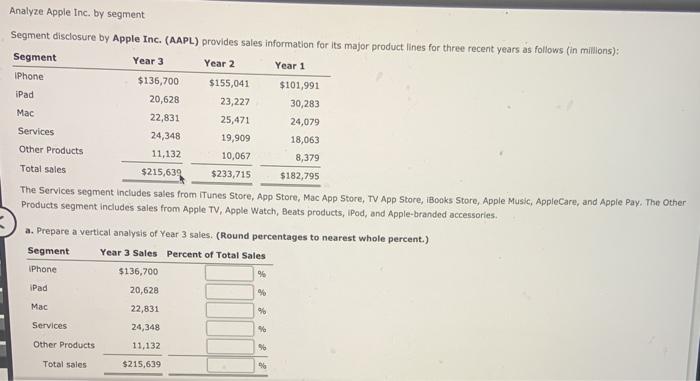
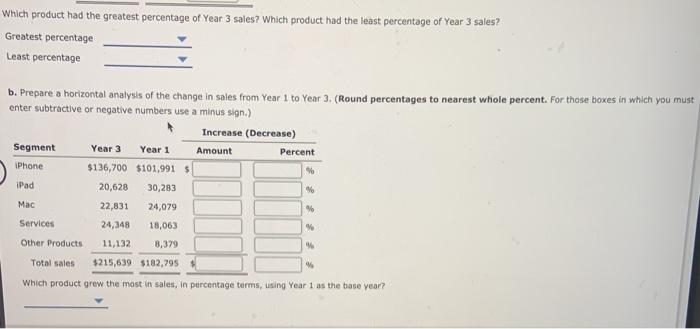
Mac Analyze Apple Inc. by segment Segment disclosure by Apple Inc. (AAPL) provides sales information for its major product lines for three recent years as follows (in Millions): Segment Year 3 Year 2 Year 1 IPhone $136,700 $155,041 $101,991 iPad 20,628 23,227 30,283 22,831 25,471 24,079 Services 24,348 19,909 18,063 Other Products 11,132 10,067 8,379 Total sales $215,639 $233,715 $182,795 The Services segment includes sales from iTunes Store, App Store, Mac App Store, TV App Store, Books Store, Apple Music, AppleCare, and Apple Pay. The Other Products segment includes sales from Apple TV, Apple Watch, Beats products, iPod, and Apple-branded accessories. a. Prepare a vertical analysis of Year 3 sales. (Round percentages to nearest whole percent.) Segment Year 3 Sales Percent of Total Sales IPhone $136,700 96 Pad 20,628 Mac 22,831 9 Services 24,348 Other Products 11,132 % Total sales $215,639 which product had the greatest percentage of Year 3 sales? Which product had the least percentage of Year 3 sales? Greatest percentage Least percentage b. Prepare a horizontal analysis of the change in sales from Year 1 to Year 3. (Round percentages to nearest whole percent. For those boxes in which you must enter subtractive or negative numbers use a minus sign.) Increase (Decrease) Segment Year 3 Percent $136,700 $101,991 $ 20,628 30,283 Year 1 Amount IPhone iPad % 22,831 24,079 % Mac Services Other Products 24,348 18,063 11,132 8,379 $215,639 $182,795 Total sales % Which product grew the most in sales, in percentage terms, using Year 1 as the base year
Step by Step Solution
There are 3 Steps involved in it

Get step-by-step solutions from verified subject matter experts