

Question: Machine learning - Linear model question. I need help with 2. (b,c,d,e). Thanks 2. We want to predict the amount of oxygen an astronaut consumes
Machine learning - Linear model question.
I need help with 2. (b,c,d,e). Thanks
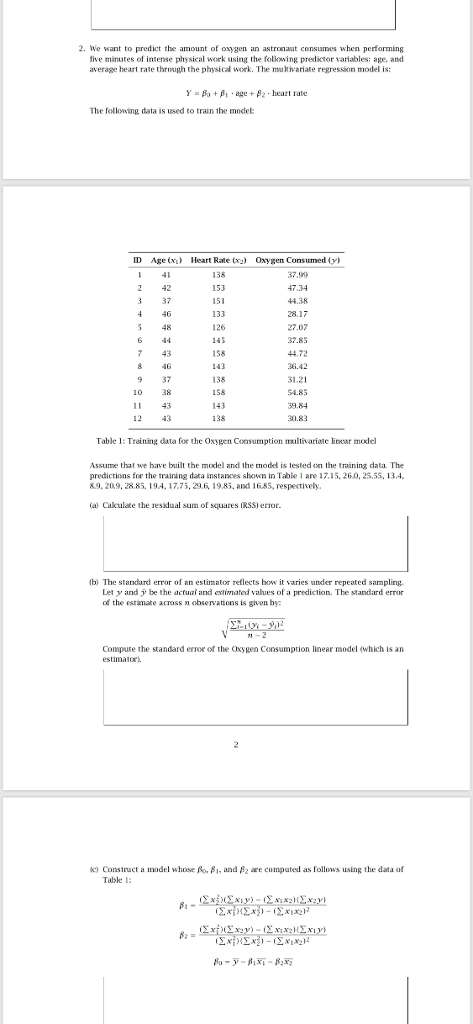
2. We want to predict the amount of oxygen an astronaut consumes when performing tive minutes of intense physical work using the folkowing prediktor variables: age, and average heart rate through the physical work. The mu tvariate regression model is: Y=8;) + \"age + 2 . heart rate The folloning data is used to train the model ID Age (xHeart Rate x) Oaygen Consumed (y) 1 4 42 3 37 4 46 5 48 6 44 7 43 8 46 9 37 10 38 11 43 12 3 138 153 151 133 126 145 158 143 138 158 143 138 7.99 47.34 44.38 28.17 27.07 37.85 44.72 36.42 31.21 4.85 39.84 0.83 Table : Training data for the Oxygen Consumption multivariate lincar model Assume that we have built the model and the moded is tested on the training data. The predictions for the training data instances shown in Tahle 1 are 17.15, 260, 25.55, 13.4 8.9, 20,9,28.85, 194.17.75, 29,6, 19.85, and 1685, respectively (a) Cakulate the resilual sum of squares RSS error. lb) The standard error of an estimator reflects bow it varies under repeated sampling. Let y and y be the actua and estimated values of a prediction. The standard error of the estimate acrossobservations is given by Compute the standard eror of the oygen Consumption linear model (which is an estimalor k. Construct a model whose A. ', and 2 are computed as follows using the data of Table 1: 2. We want to predict the amount of oxygen an astronaut consumes when performing tive minutes of intense physical work using the folkowing prediktor variables: age, and average heart rate through the physical work. The mu tvariate regression model is: Y=8;) + \"age + 2 . heart rate The folloning data is used to train the model ID Age (xHeart Rate x) Oaygen Consumed (y) 1 4 42 3 37 4 46 5 48 6 44 7 43 8 46 9 37 10 38 11 43 12 3 138 153 151 133 126 145 158 143 138 158 143 138 7.99 47.34 44.38 28.17 27.07 37.85 44.72 36.42 31.21 4.85 39.84 0.83 Table : Training data for the Oxygen Consumption multivariate lincar model Assume that we have built the model and the moded is tested on the training data. The predictions for the training data instances shown in Tahle 1 are 17.15, 260, 25.55, 13.4 8.9, 20,9,28.85, 194.17.75, 29,6, 19.85, and 1685, respectively (a) Cakulate the resilual sum of squares RSS error. lb) The standard error of an estimator reflects bow it varies under repeated sampling. Let y and y be the actua and estimated values of a prediction. The standard error of the estimate acrossobservations is given by Compute the standard eror of the oygen Consumption linear model (which is an estimalor k. Construct a model whose A. ', and 2 are computed as follows using the data of Table 1
Step by Step Solution
There are 3 Steps involved in it

Get step-by-step solutions from verified subject matter experts