

Question: Mail - Phi X D21 Read the X D2L Grades - / X | MindTap X |$ SCC Stude X | G Kaliah's P X
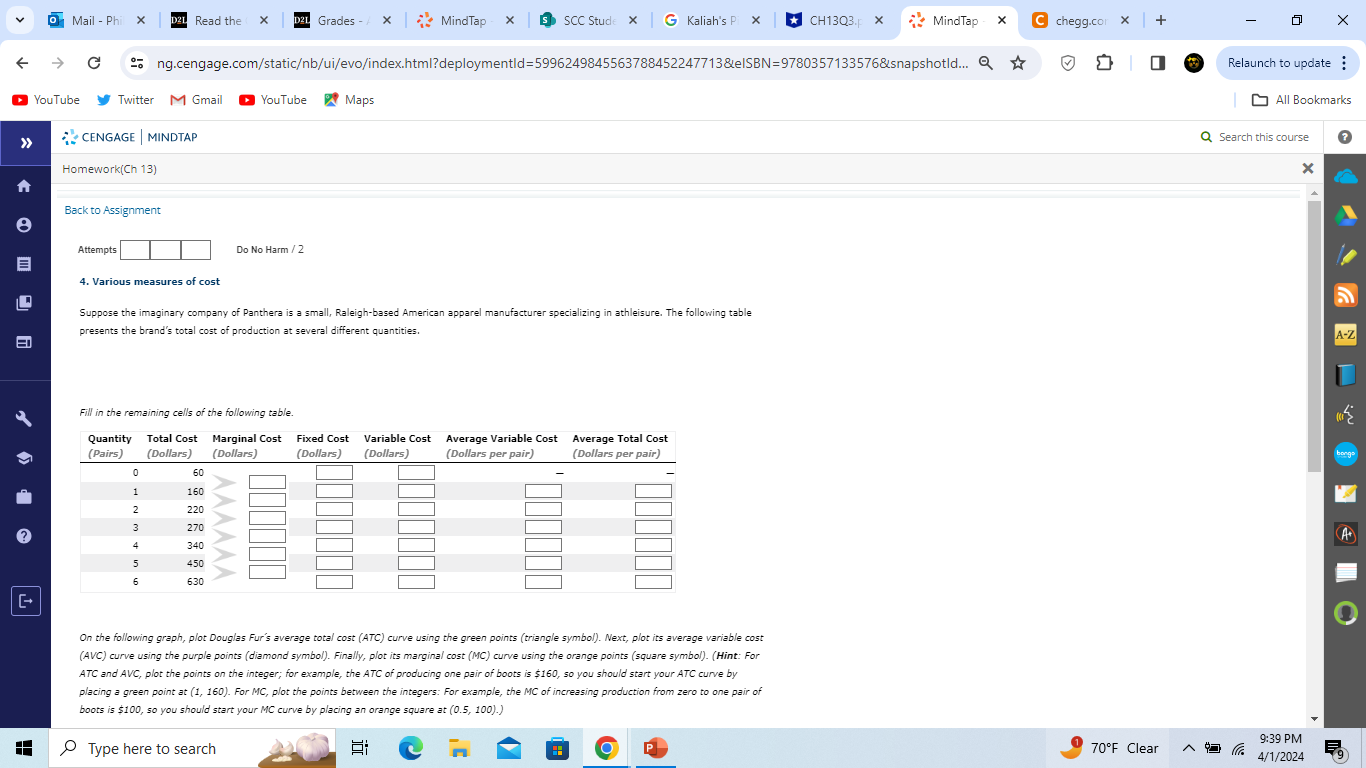
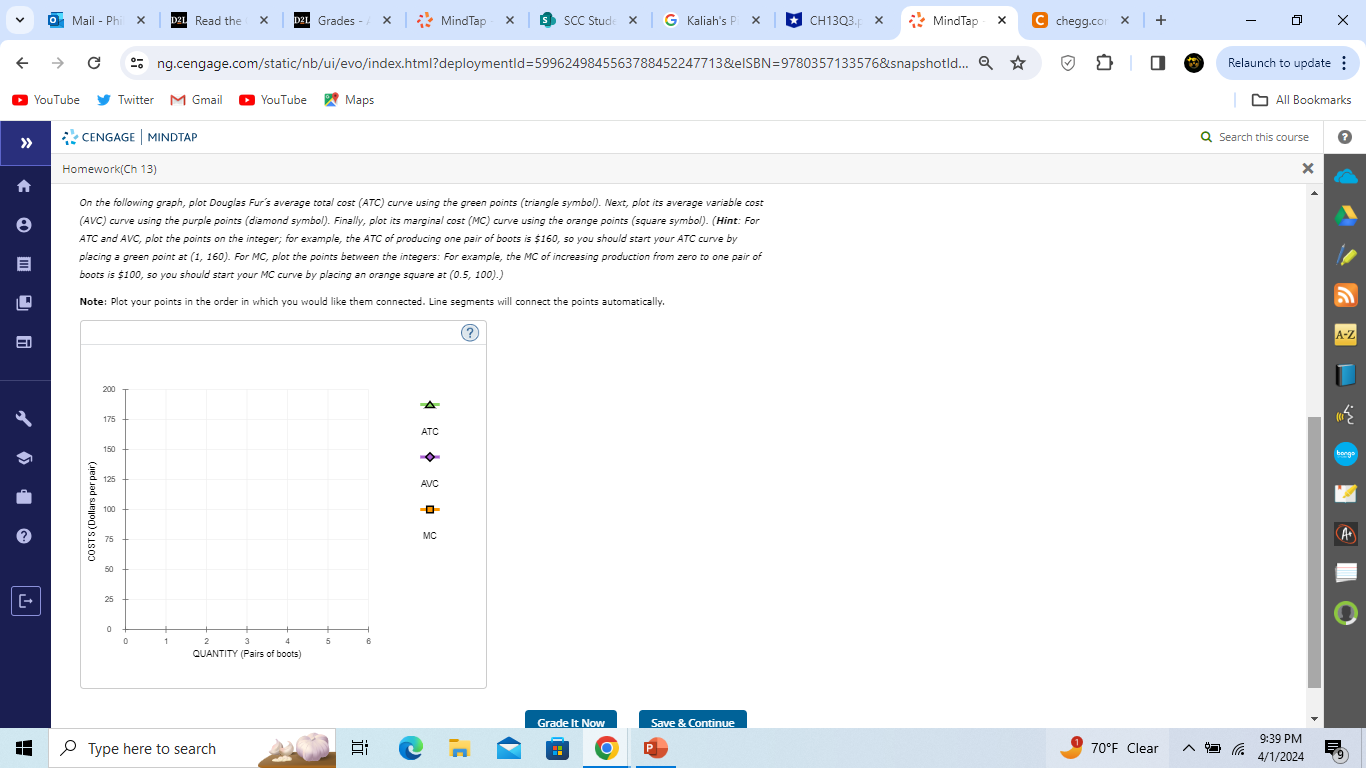
Mail - Phi X D21 Read the X D2L Grades - / X | MindTap X |$ SCC Stude X | G Kaliah's P X * CH13Q3.p x MindTap X C chegg.cor x + X G 26 ng.cengage.com/staticb/ui/evo/index.html?deploymentld=5996249845563788452247713&eISBN=9780357133576&snapshotld... Q Relaunch to update : You Tube Twitter M Gmail YouTube V Maps All Bookmarks CENGAGE | MINDTAP Q Search this course ? Homework(Ch 13) X Back to Assignment Attempts Do No Harm / 2 E 4. Various measures of cost Suppose the imaginary company of Panthera is a small, Raleigh-based American apparel manufacturer specializing in athleisure. The following table presents the brand's total cost of production at several different quantities. A-Z Fill in the remaining cells of the following table. Quantity Total Cost Marginal Cost Fixed Cost Variable Cost Average Variable Cost Average Total Cost (Pairs) (Dollars) (Dollars) (Dollars) (Dollars) Dollars per pair) "Dollars per pair) barge 0 60 160 220 W N 270 ? A+ 4 340 450 630 C- O On the following graph, plot Douglas Fur's average total cost (ATC) curve using the green points (triangle symbol). Next, plot its average variable cost (AVC) curve using the purple points (diamond symbol). Finally, plot its marginal cost (MC) curve using the orange points (square symbol). (Hint: For ATC and AVC, plot the points on the integer; for example, the ATC of producing one pair of boots is $160, so you should start your ATC curve by placing a green point at (1, 160). For MC, plot the points between the integers: For example, the MC of increasing production from zero to one pair of boots is $100, so you should start your MC curve by placing an orange square at (0.5, 100).) 9:39 PM Type here to search O P 70OF Clear 4/1/2024Mail - Phi X D21 Read the X D2L Grades - / X | MindTap X |$ SCC Stude X | G Kaliah's P X * CH13Q3.p x MindTap X C chegg.cor x + X G 26 ng.cengage.com/staticb/ui/evo/index.html?deploymentld=5996249845563788452247713&eISBN=9780357133576&snapshotld... Q Relaunch to update : You Tube Twitter M Gmail YouTube V Maps All Bookmarks CENGAGE | MINDTAP Q Search this course ? Homework(Ch 13) X On the following graph, plot Douglas Fur's average total cost (ATC) curve using the green points (triangle symbol). Next, plot its average variable cost (AVC) curve using the purple points (diamond symbol). Finally, plot its marginal cost (MC) curve using the orange points (square symbol). (Hint: For ATC and AVC, plot the points on the integer; for example, the ATC of producing one pair of boots is $160, so you should start your ATC curve by E placing a green point at (1, 160). For MC, plot the points between the integers: For example, the MC of increasing production from zero to one pair of boots is $100, so you should start your MC curve by placing an orange square at (0.5, 100).) Note: Plot your points in the order in which you would like them connected. Line segments will connect the points automatically. (? A-Z 200 A 175 ATC 150 bongs 125 AVC COSTS (Dollars per pair) 100 -0 MC A+ 50 C+ 25 0 3 5 QUANTITY (Pairs of boots) Grade It Now Save & Continue 9:39 PM Type here to search O P 70OF Clear " 4/1/2024
Step by Step Solution
There are 3 Steps involved in it

Get step-by-step solutions from verified subject matter experts