

Question: maintenance 2. The following table illustrates a sample of task times observations. Use the information in the table to calculate your responses for each
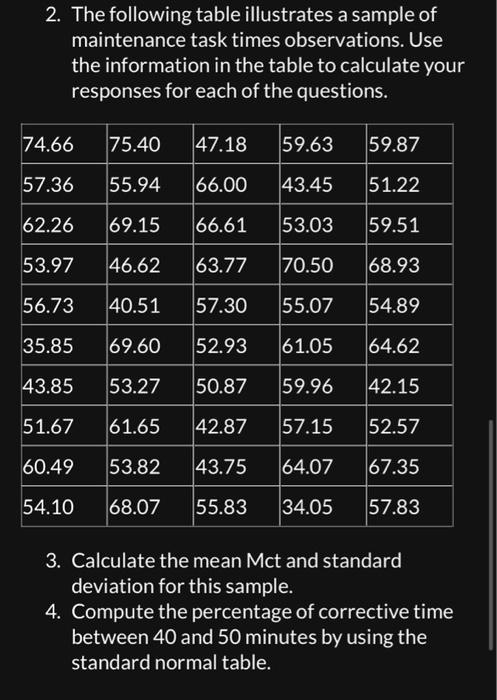
maintenance 2. The following table illustrates a sample of task times observations. Use the information in the table to calculate your responses for each of the questions. 74.66 75.40 47.18 59.63 59.87 57.36 55.94 66.00 43.45 51.22 62.26 69.15 66.61 53.03 59.51 53.97 46.62 63.77 70.50 68.93 56.73 40.51 57.30 55.07 54.89 35.85 69.60 52.93 61.05 64.62 43.85 53.27 50.87 59.96 42.15 51.67 61.65 42.87 57.15 52.57 60.49 53.82 43.75 64.07 67.35 54.10 68.07 55.83 34.05 57.83 3. Calculate the mean Mct and standard deviation for this sample. 4. Compute the percentage of corrective time between 40 and 50 minutes by using the standard normal table.
Step by Step Solution
3.34 Rating (163 Votes )
There are 3 Steps involved in it

Get step-by-step solutions from verified subject matter experts