

Question: Make 2 Graphs (but combine them into one graph and use the legend option to identify which graph is for the Sales or Moving Average):
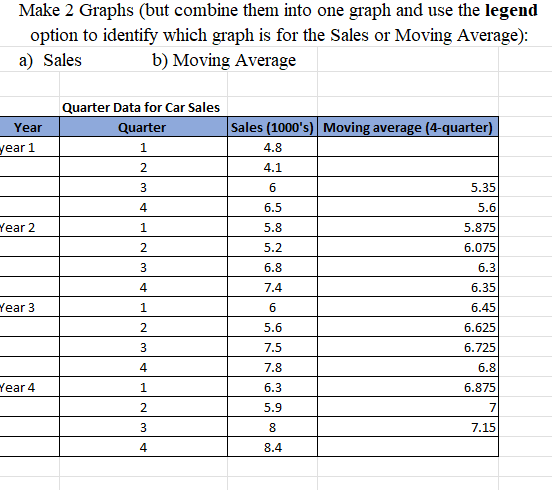
Make 2 Graphs (but combine them into one graph and use the legend option to identify which graph is for the Sales or Moving Average): a) Sales b) Moving Average Quarter Data for Car Sales Year Quarter Sales (1000's) Moving average (4-quarter) rear 1 1 4.8 2 4.1 6 5.35 4 6.5 5.6 Year 2 5.8 5.875 5.2 6.075 6.8 6.3 7.4 6.35 Year 3 6 6.45 5.6 6.625 7.5 6.725 7.8 6.8 fear 4 6.3 6.875 5.9 7 8 7.15 8.4
Step by Step Solution
There are 3 Steps involved in it
1 Expert Approved Answer
Step: 1 Unlock

Question Has Been Solved by an Expert!
Get step-by-step solutions from verified subject matter experts
Step: 2 Unlock
Step: 3 Unlock