

Question: make a business executive summary, maximum one page, with the findings of the cash flow statements. Guiding questions: How often is the company low on
make a business executive summary, maximum one page, with the findings of the cash flow statements. Guiding questions:
- How often is the company low on cash? Is there any seasonality to those low periods of cash?
- Is this issue due to lack of sales? Expenses being too high? Lack of Account Receivables collections?
- What would you recommend for the company to do to improve their cash position? What financial strategies could the company adopt?
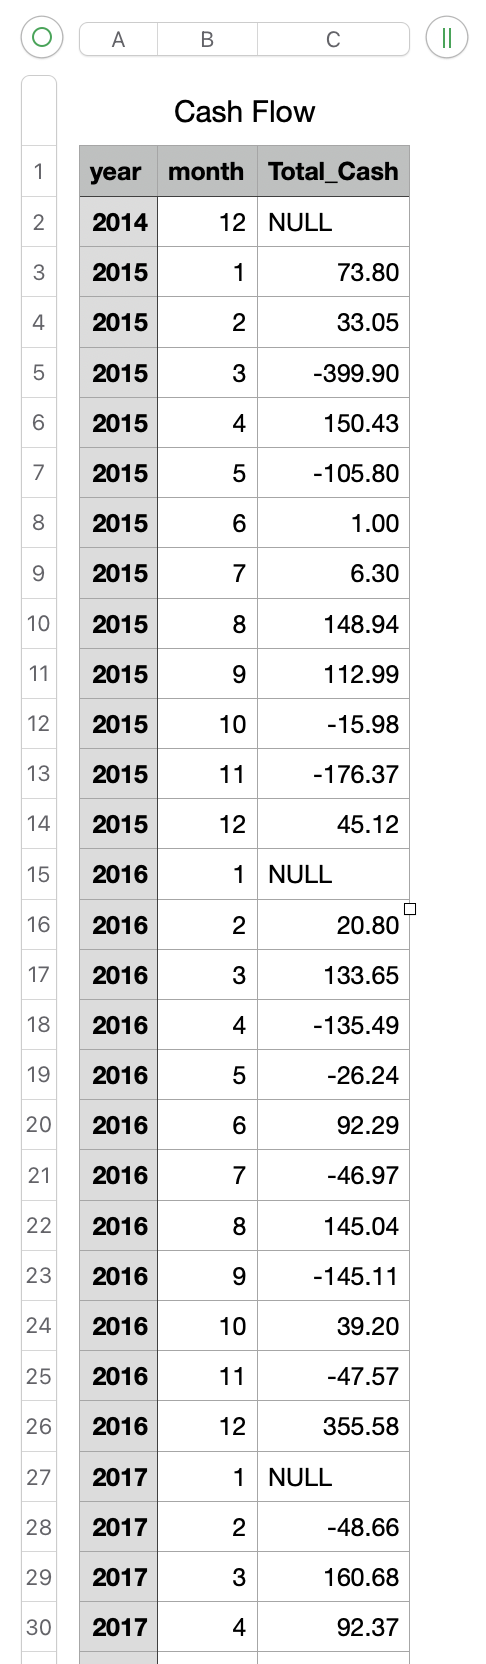
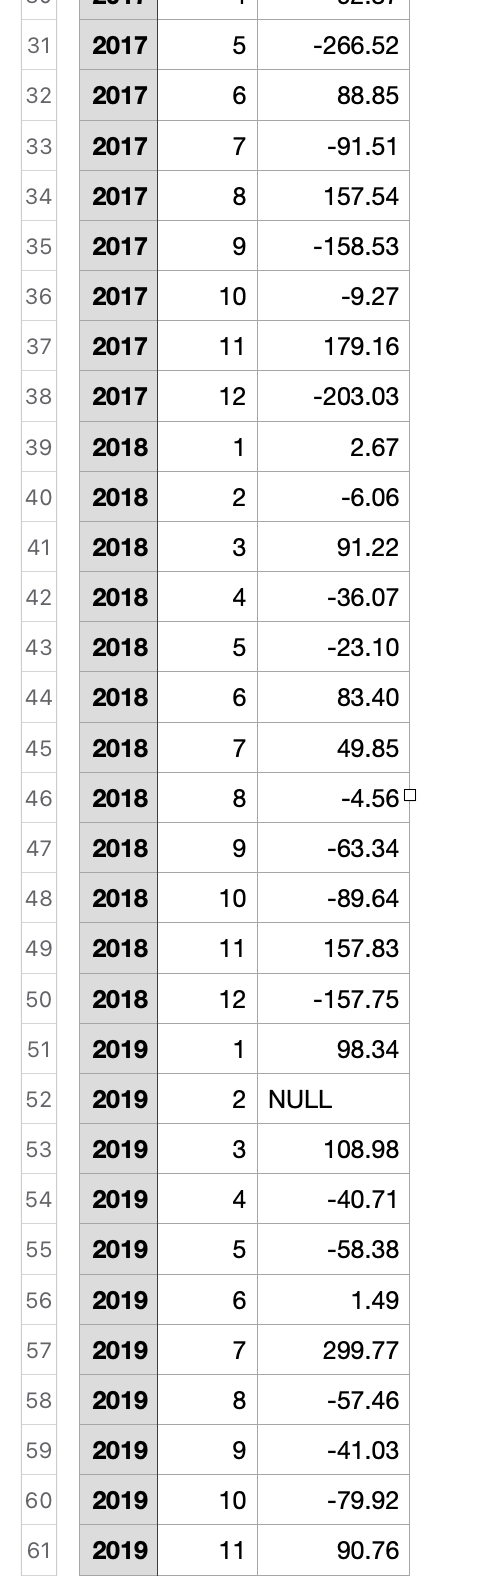
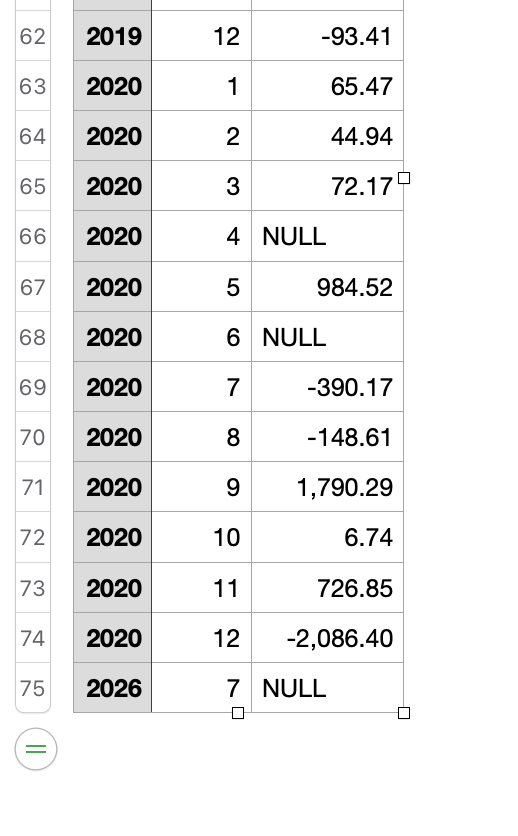
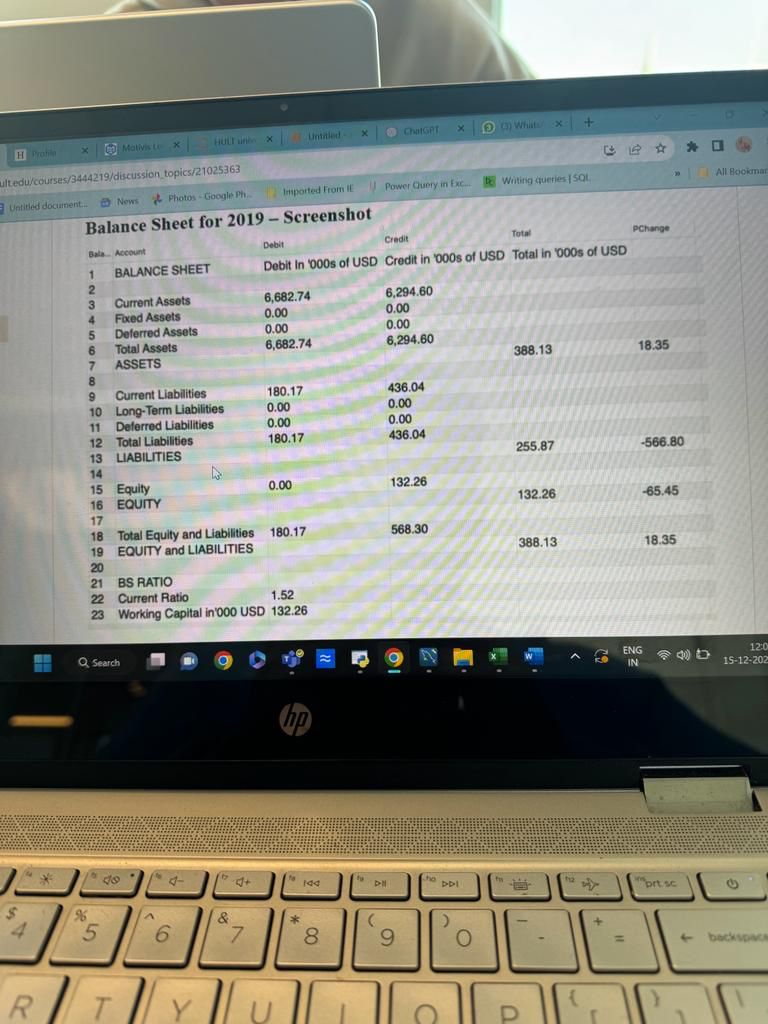
BCA2 (1) \begin{tabular}{|c|c|c|} \hline A & B & C \\ \hline \multicolumn{3}{|c|}{ Cash Flow } \\ \hline year & month & Total_Cash \\ \hline 2014 & 12 & NULL \\ \hline 2015 & 1 & 73.80 \\ \hline 2015 & 2 & 33.05 \\ \hline 2015 & 3 & -399.90 \\ \hline 2015 & 4 & 150.43 \\ \hline 2015 & 5 & -105.80 \\ \hline 2015 & 6 & 1.00 \\ \hline 2015 & 7 & 6.30 \\ \hline 2015 & 8 & 148.94 \\ \hline 2015 & 9 & 112.99 \\ \hline 2015 & 10 & -15.98 \\ \hline 2015 & 11 & -176.37 \\ \hline 2015 & 12 & 45.12 \\ \hline 2016 & 1 & NULL \\ \hline 2016 & 2 & 20.80 \\ \hline 2016 & 3 & 133.65 \\ \hline 2016 & 4 & -135.49 \\ \hline 2016 & 5 & -26.24 \\ \hline 2016 & 6 & 92.29 \\ \hline 2016 & 7 & -46.97 \\ \hline 2016 & 8 & 145.04 \\ \hline 2016 & 9 & -145.11 \\ \hline 2016 & 10 & 39.20 \\ \hline 2016 & 11 & -47.57 \\ \hline 2016 & 12 & 355.58 \\ \hline 2017 & 1 & NULL \\ \hline 2017 & 2 & -48.66 \\ \hline 2017 & 3 & 160.68 \\ \hline 2017 & 4 & 92.37 \\ \hline \end{tabular} \begin{tabular}{|r|r|r|r|} \hline 31 & 2017 & 5 & -266.52 \\ \hline 32 & 2017 & 6 & 88.85 \\ \hline 33 & 2017 & 7 & -91.51 \\ \hline 34 & 2017 & 8 & 157.54 \\ \hline 35 & 2017 & 9 & -158.53 \\ \hline 36 & 2017 & 10 & -9.27 \\ \hline 37 & 2017 & 11 & 179.16 \\ \hline 38 & 2017 & 12 & -203.03 \\ \hline 39 & 2018 & 1 & 2.67 \\ \hline 40 & 2018 & 2 & -6.06 \\ \hline 41 & 2018 & 3 & 91.22 \\ \hline 42 & 2018 & 4 & -36.07 \\ \hline 43 & 2018 & 5 & -23.10 \\ \hline 44 & 2018 & 6 & 83.40 \\ \hline 45 & 2018 & 7 & 49.85 \\ \hline 46 & 2018 & 8 & -4.56 \\ \hline 47 & 2018 & 9 & -63.34 \\ \hline 48 & 2018 & 10 & -89.64 \\ \hline 49 & 2018 & 11 & 157.83 \\ \hline 50 & 2018 & 12 & -157.75 \\ \hline 51 & 2019 & 1 & 98.34 \\ \hline 52 & 2019 & 2 & NULL \\ \hline 53 & 2019 & 3 & 108.98 \\ \hline 54 & 2019 & 4 & -40.71 \\ \hline 55 & 2019 & 5 & -58.38 \\ \hline 56 & 2019 & 6 & 1.49 \\ \hline 57 & 2019 & 7 & 299.77 \\ \hline 58 & 2019 & 8 & -57.46 \\ \hline 59 & 2019 & 9 & -41.03 \\ \hline 60 & 2019 & 10 & -79.92 \\ \hline 61 & 2019 & 11 & 90.76 \\ \hline \end{tabular} \begin{tabular}{|r|r|r|r|} \hline 62 & 2019 & 12 & -93.41 \\ \hline 63 & 2020 & 1 & 65.47 \\ \hline 64 & 2020 & 2 & 44.94 \\ \hline 65 & 2020 & 3 & 72.17 \\ \hline 66 & 2020 & 4 & NULL \\ \hline 67 & 2020 & 5 & 984.52 \\ \hline 68 & 2020 & 6 & NULL \\ \hline 69 & 2020 & 7 & -390.17 \\ \hline 70 & 2020 & 8 & -148.61 \\ \hline 71 & 2020 & 9 & 1,790.29 \\ \hline 72 & 2020 & 10 & \\ \hline 73 & 2020 & 11 & 726.85 \\ \hline 74 & 2020 & 12 & 2,086.40 \\ \hline 75 & 2026 & 7 & NULL \\ \hline \end{tabular} Untitled document. Nows Photos - Google . innported from II Power Guery in fxe: Whiting queries I SOL. Balance Sheet for 2019 - Screenshot Bala Nccount 1 BALANCE SHEET 2 3 Current:Assets 4 Foxed Assets 5 Deferred Assets 6 Total Assets 7 ASSETS 8 9 10 11 12 13 Current Liabilities Long-Term Liabilities Deferred Liabilities Total Liabilities LIABILITIES Equity EQUITY Total Equity and Liabilities EQUITY and LIABILITIES BS RATIO Current Ratio Working Capital in'000 USD 132.26 Debit. Credit fotal pchange Debit in 000 s of USD Credit in '000s of USD Total in "000s of USD 6,682.74 6,294.60 0.00 0.00 6,294.60 388.13 18.35 0.00 6,682.74 180.17 436.04 0.00 0.00 0.00 0.00 180.17 436.04 255.87 566.80 0.00 132.26 132.26 65.45 180.17 568.30 388.13 18.35 14 15 16 17 18 19 20 21 22 23
Step by Step Solution
There are 3 Steps involved in it

Get step-by-step solutions from verified subject matter experts