

Question: Make a comprehensive report about the life expectancy and HDI (Human Development Index) in the Philippines. Life Expectancy HDI (Human Development Index) Also provide what
Make a comprehensive report about the life expectancy and HDI (Human Development Index) in the Philippines.
- Life Expectancy
- HDI (Human Development Index)
Also provide what happened why the life expectancy and HDI became like that in the Philippines.
Use the table below for information.
Life Expectancy table:
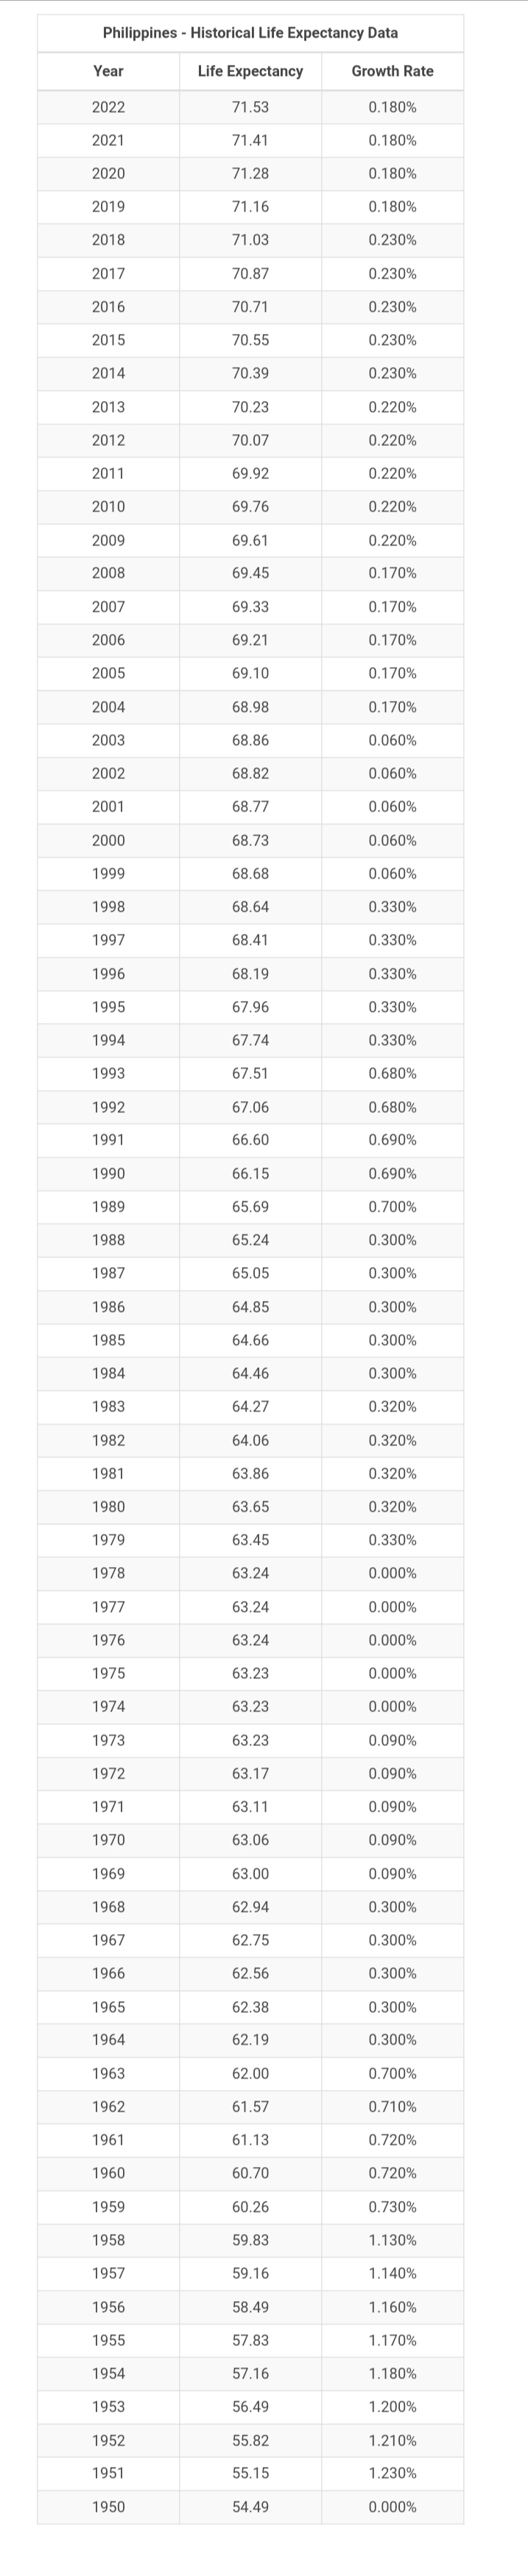
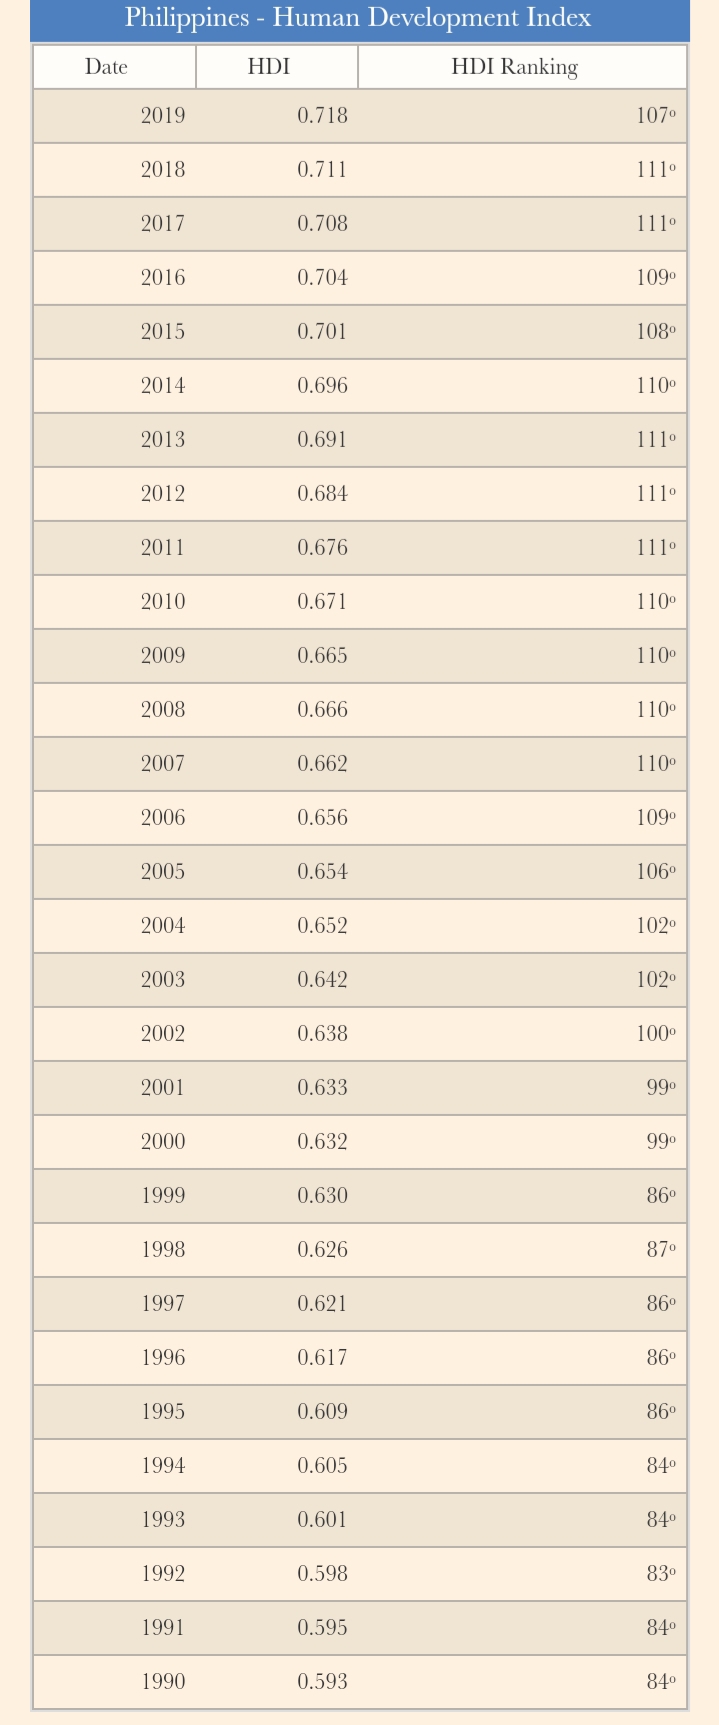
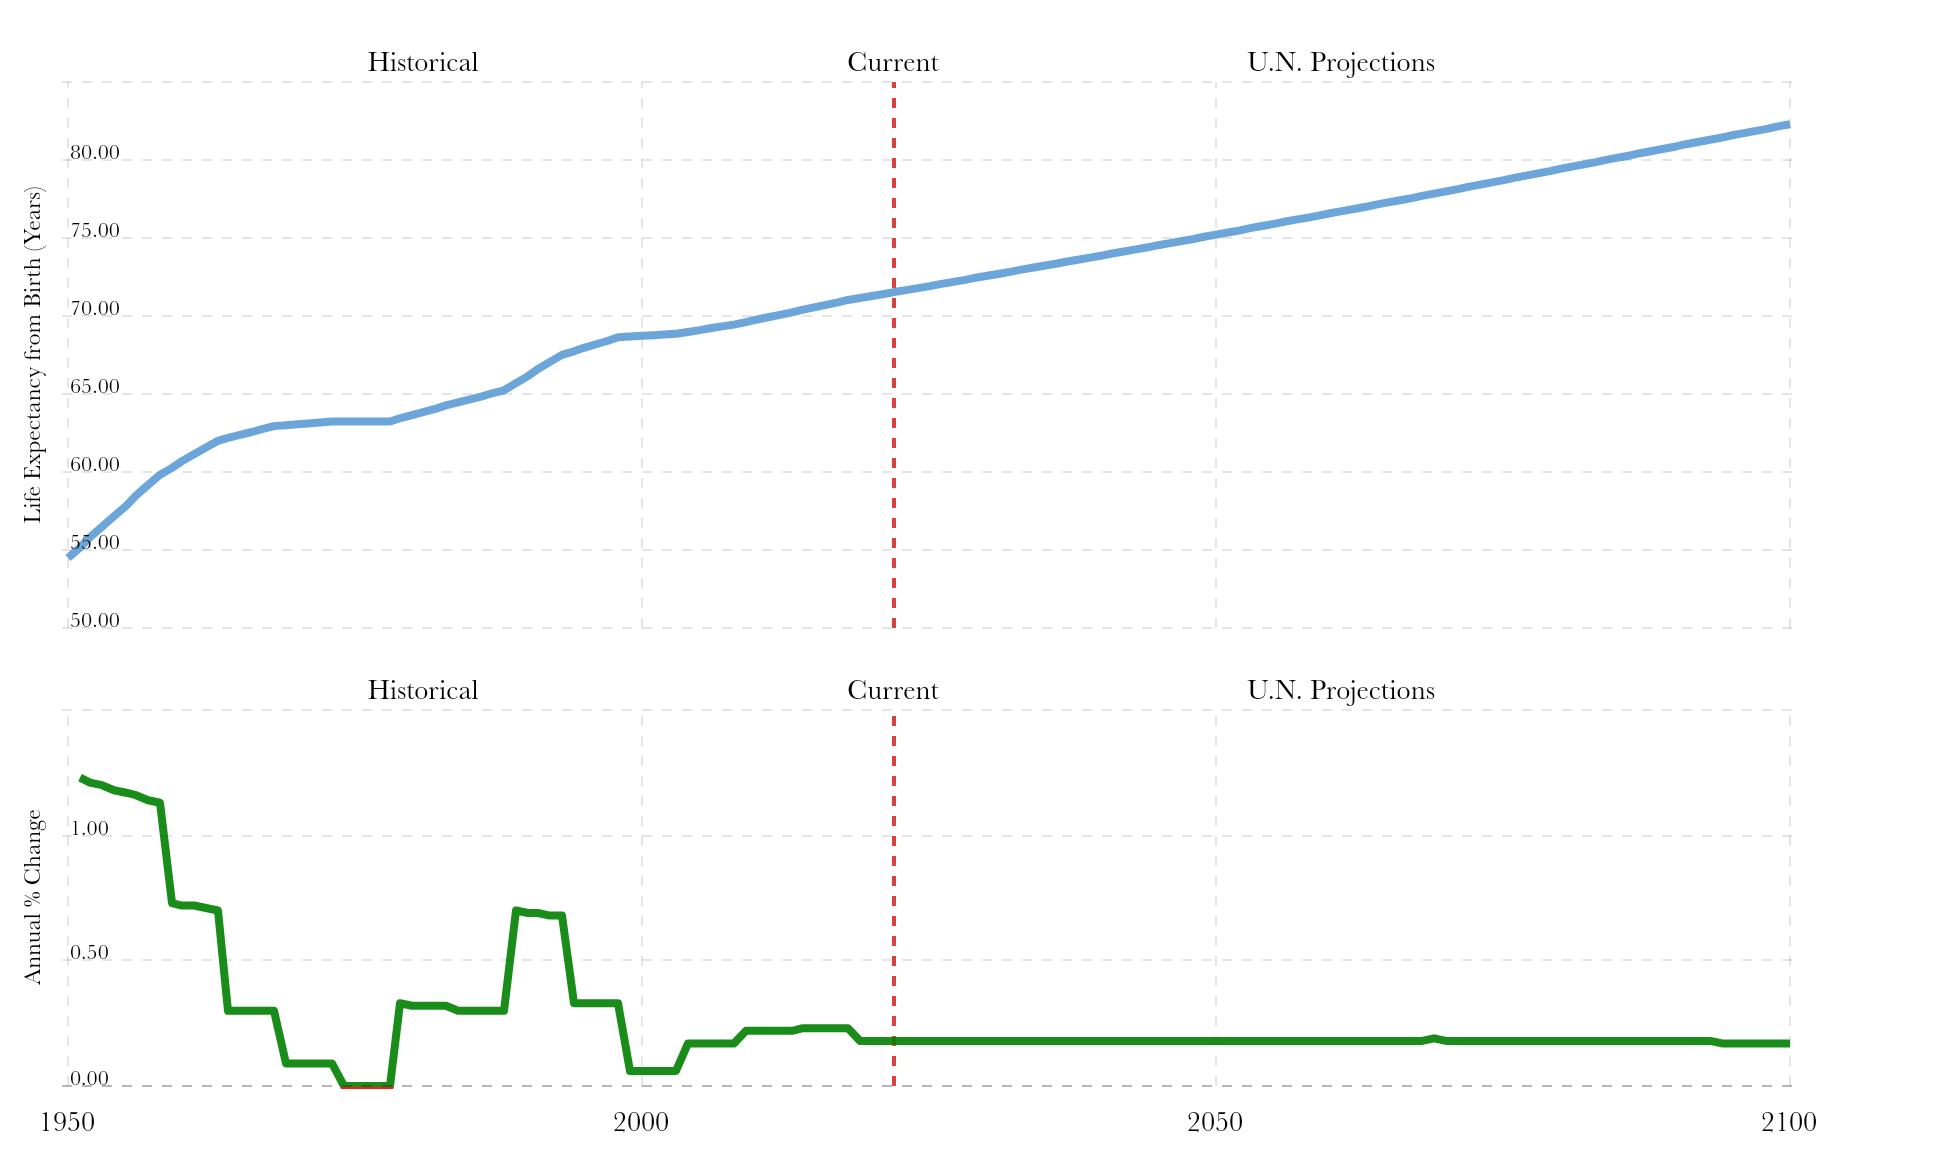
Philippines - Historical Life Expectancy Data Year Life Expectancy Growth Rate 2022 71.53 0.180% 2021 71.41 0.180% 2020 71.28 0.180% 2019 71.16 0.180% 2018 71.03 0.230% 2017 70.87 0.230% 2016 70.71 0.230% 2015 70.55 0.230% 2014 70.39 0.230% 2013 70.23 0.220% 2012 70.07 0.220% 2011 69.92 0.220% 2010 69.76 0.220% 2009 69.61 0.220% 2008 69.45 0.170% 2007 69.33 0.170% 2006 59.21 0.170% 2005 69.10 0.170% 2004 58.98 0.170% 2003 68.86 0.060% 2002 58.82 0.060% 2001 58.77 0.060% 2000 58.73 0.060% 1999 68.68 0.060% 1998 58.64 0.330% 1997 68.41 0.330% 1996 68.19 0.330% 1995 67.96 0.330% 1994 57.74 0.330% 1993 67.51 0.680% 1992 67.06 0.680% 1991 66.60 0.690% 1990 66.15 0.690% 1989 65.69 0.700% 1988 65.24 0.300% 1987 65.05 0.300% 1986 64.85 0.300% 1985 64.66 0.300% 1984 64.46 0.300% 1983 64.27 0.320% 1982 64.06 0.320% 1981 63.86 0.320% 1980 63.65 0.320% 1979 63.45 0.330% 1978 63.24 0.000% 1977 63.24 0.000% 1976 63.24 0.000% 1975 53.23 0.000% 1974 63.23 0.000% 1973 53.23 0.090% 1972 63.17 0.090% 1971 63.11 0.090% 1970 63.06 0.090% 1969 63.00 0.090% 1968 62.94 0.300% 1967 62.75 0.300% 1966 62.56 0.300% 1965 62.38 0.300% 1964 62.19 0.300% 1963 62.00 0.700% 1962 61.57 0.710% 1961 61.13 0.720% 1960 0.70 0.720% 1959 60.26 0.730% 1958 59.83 1.130% 1957 59.16 1.140% 1956 58.49 1.160% 1955 57.83 1.1709 1954 57.16 1.180% 1953 56.49 1.200% 1952 55.82 1.210% 1951 55.15 1.230% 1950 54.49 0.000%Philippines - Human Development Index Date HDI HDI Ranking 2019 0.718 1070 2018 0.711 1 1 10 2017 0.708 1 1 10 2016 0.704 1090 2015 0.701 1080 2014 0.696 1 10 2013 0.691 11 10 2012 0.684 11 10 2011 0.676 11 10 2010 0.671 1 10 2009 0.665 1 10 2008 0.666 1 10 2007 0.662 1 10 2006 0.656 1090 2005 0.654 1060 2004 0.652 1020 2003 0.642 1020 2002 0.638 100 2001 0.633 990 2000 0.632 990 1999 0.630 86 1998 0.626 870 1997 0.621 86 1996 0.617 86 1995 0.609 86 1994 0.605 840 1993 0.601 840 1992 0.598 830 1991 0.595 84 1990 0.593 840Historical Current U.N. Projections 80.00 75.00 70.00 Life Expectancy from Birth (Years) 65.00 60.00 155.00 50.00 Historical Current U.N. Projections 1.00 Annual % Change 0.50 0.00 1950 2000 2050 2100
Step by Step Solution
There are 3 Steps involved in it

Get step-by-step solutions from verified subject matter experts