

Question: Make a documented MATLAB script called HW1_3.m that does all of the following: Creates variables El = 3 and L = 2 (these are just
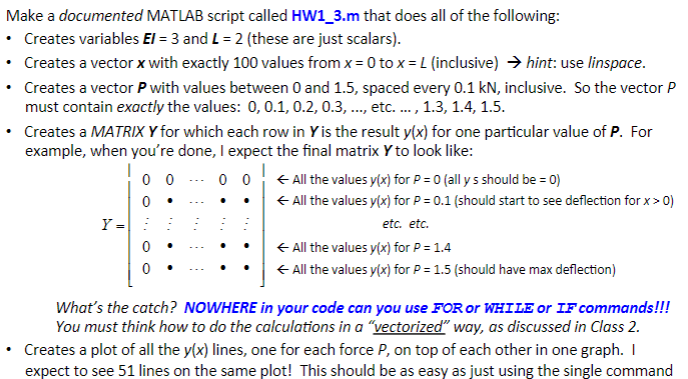
Make a documented MATLAB script called HW1_3.m that does all of the following: Creates variables El = 3 and L = 2 (these are just scalars). Creates a vector x with exactly 100 values from x = 0 to x=L(inclusive) hint: use linspace. Creates a vector P with values between 0 and 1.5, spaced every 0.1 kN, inclusive. So the vector p must contain exactly the values: 0, 0.1, 0.2, 0.3, ..., etc. ..., 1.3, 1.4, 1.5. Creates a MATRIX Y for which each row in Y is the result y(x) for one particular value of P. For example, when you're done, I expect the final matrix Y to look like: 0 0 - 0 0 All the values y(x) for P = 0 (all y s should be = 0) 0 . . . . All the values y(x) for p = 0.1 (should start to see deflection for x > 0) Y 0 . .... All the values y(x) for p = 1.4 0 .- All the values y(x) for p = 1.5 (should have max deflection) etc. etc. What's the catch? NOWHERE in your code can you use FOR or WHILE or IF commands!!! You must think how to do the calculations in a "vectorized" way, as discussed in Class 2. Creates a plot of all the y(x) lines, one for each force P, on top of each other in one graph. I expect to see 51 lines on the same plot! This should be as easy as just using the single command Make a documented MATLAB script called HW1_3.m that does all of the following: Creates variables El = 3 and L = 2 (these are just scalars). Creates a vector x with exactly 100 values from x = 0 to x=L(inclusive) hint: use linspace. Creates a vector P with values between 0 and 1.5, spaced every 0.1 kN, inclusive. So the vector p must contain exactly the values: 0, 0.1, 0.2, 0.3, ..., etc. ..., 1.3, 1.4, 1.5. Creates a MATRIX Y for which each row in Y is the result y(x) for one particular value of P. For example, when you're done, I expect the final matrix Y to look like: 0 0 - 0 0 All the values y(x) for P = 0 (all y s should be = 0) 0 . . . . All the values y(x) for p = 0.1 (should start to see deflection for x > 0) Y 0 . .... All the values y(x) for p = 1.4 0 .- All the values y(x) for p = 1.5 (should have max deflection) etc. etc. What's the catch? NOWHERE in your code can you use FOR or WHILE or IF commands!!! You must think how to do the calculations in a "vectorized" way, as discussed in Class 2. Creates a plot of all the y(x) lines, one for each force P, on top of each other in one graph. I expect to see 51 lines on the same plot! This should be as easy as just using the single command
Step by Step Solution
There are 3 Steps involved in it

Get step-by-step solutions from verified subject matter experts