

Question: Make a graph label the X and Y axis using excel also label the slope do a graph time versus position in KM based on
Make a graph label the X and Y axis using excel also label the slope do a graph time versus position in KM based on the 4 different categories also find the speed of sound please make 4 different lines for the graph
Ok
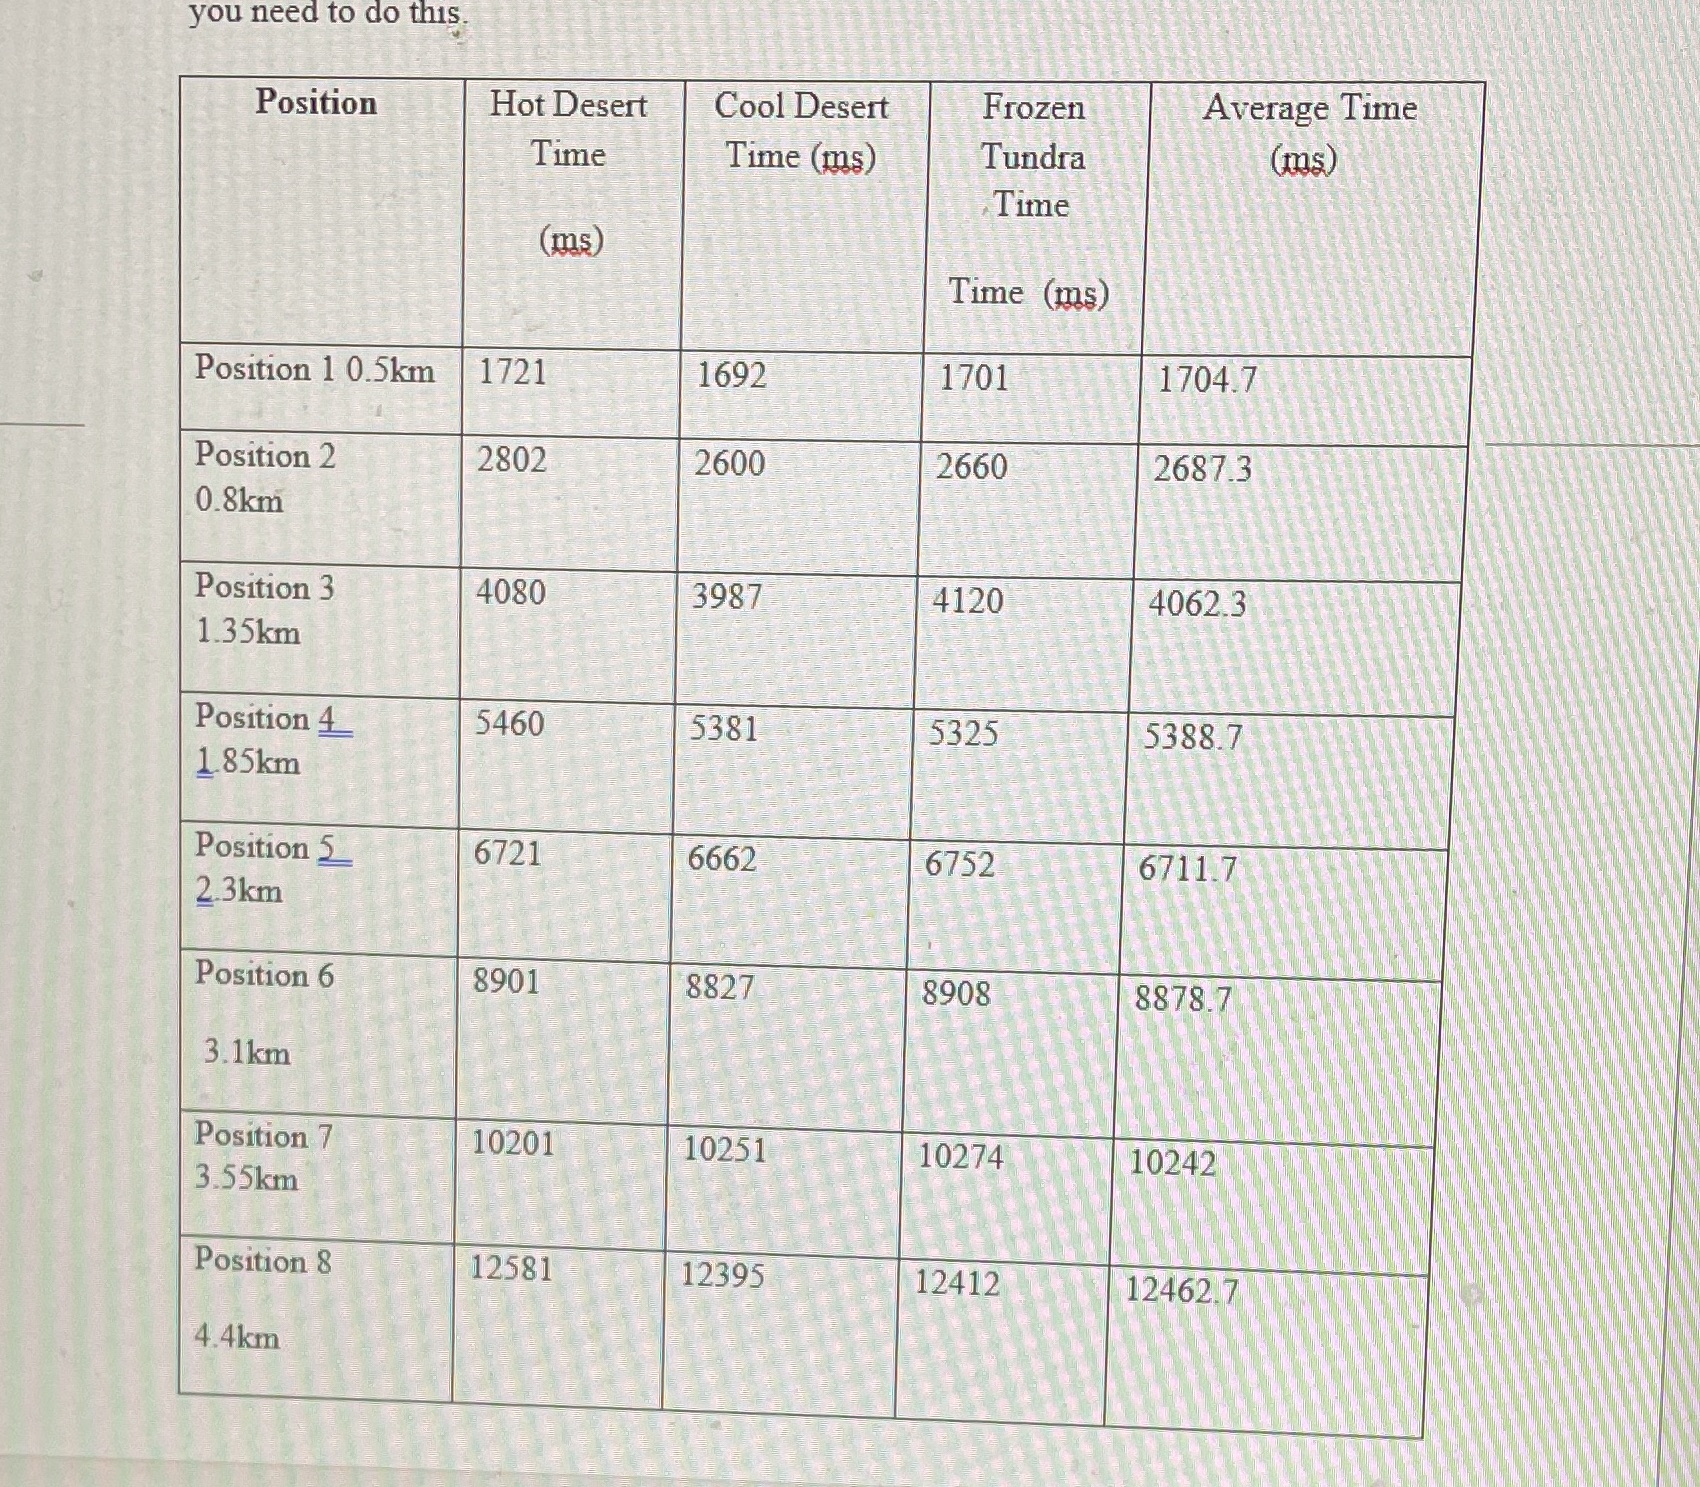
you need to do this. Position Hot Desert Cool Desert Frozen Average Time Time Time (ms) Tundra ms Time (ms) Time (ms) Position 1 0.5km 1721 1692 1701 1704.7 Position 2 2802 2600 2660 2687.3 0.8km Position 3 4080 3987 4120 4062.3 1.35km Position 4 5460 5381 5325 5388.7 185km Position S 6721 6662 6752 6711 7 2.3km Position 6 8901 8827 8908 8878.7 3.1km Position 7 10201 10251 10274 10242 3.55km Position 8 12581 12395 12412 12462 7 4.4km
Step by Step Solution
There are 3 Steps involved in it

Get step-by-step solutions from verified subject matter experts