

Question: Make a graph of this data table on exel please. it should be 2line. Data Table 2.3 Time and Distance Date for Rolling Ball Distance
Make a graph of this data table on exel please. it should be 2line.
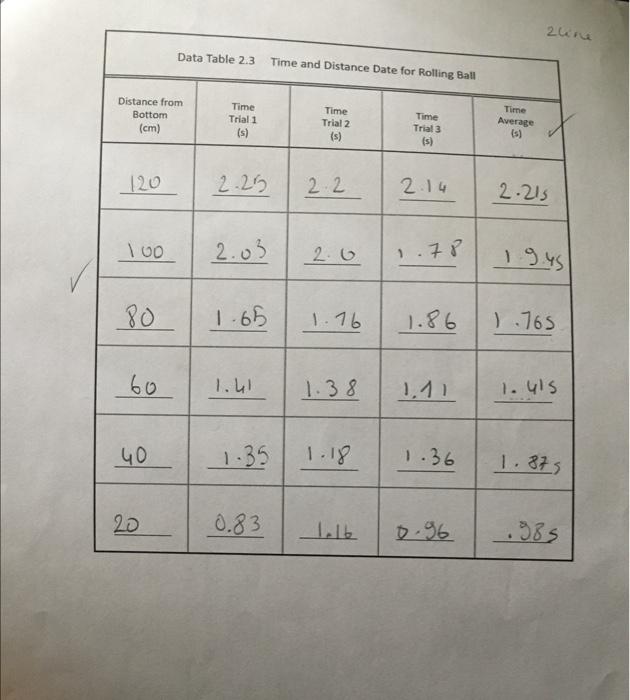
Data Table 2.3 Time and Distance Date for Rolling Ball Distance from Time Time Time Bottom Time Trial 1 Trial 2 Average (cm) Trial 3 (s) (s) (5) 120 2.25 2 2 2.14 2.215 100 2. 05 2. 0 1.7 8 1 9:45 80 1- 65 1 . 76 1.86 1 .765 60 1. 41 1. 38 1.1 1 1. 415 40 1.35 1 . 18 1. 36 1. 875 20 0.83 1. 96 . 3BS
Step by Step Solution
There are 3 Steps involved in it
1 Expert Approved Answer
Step: 1 Unlock

Question Has Been Solved by an Expert!
Get step-by-step solutions from verified subject matter experts
Step: 2 Unlock
Step: 3 Unlock