

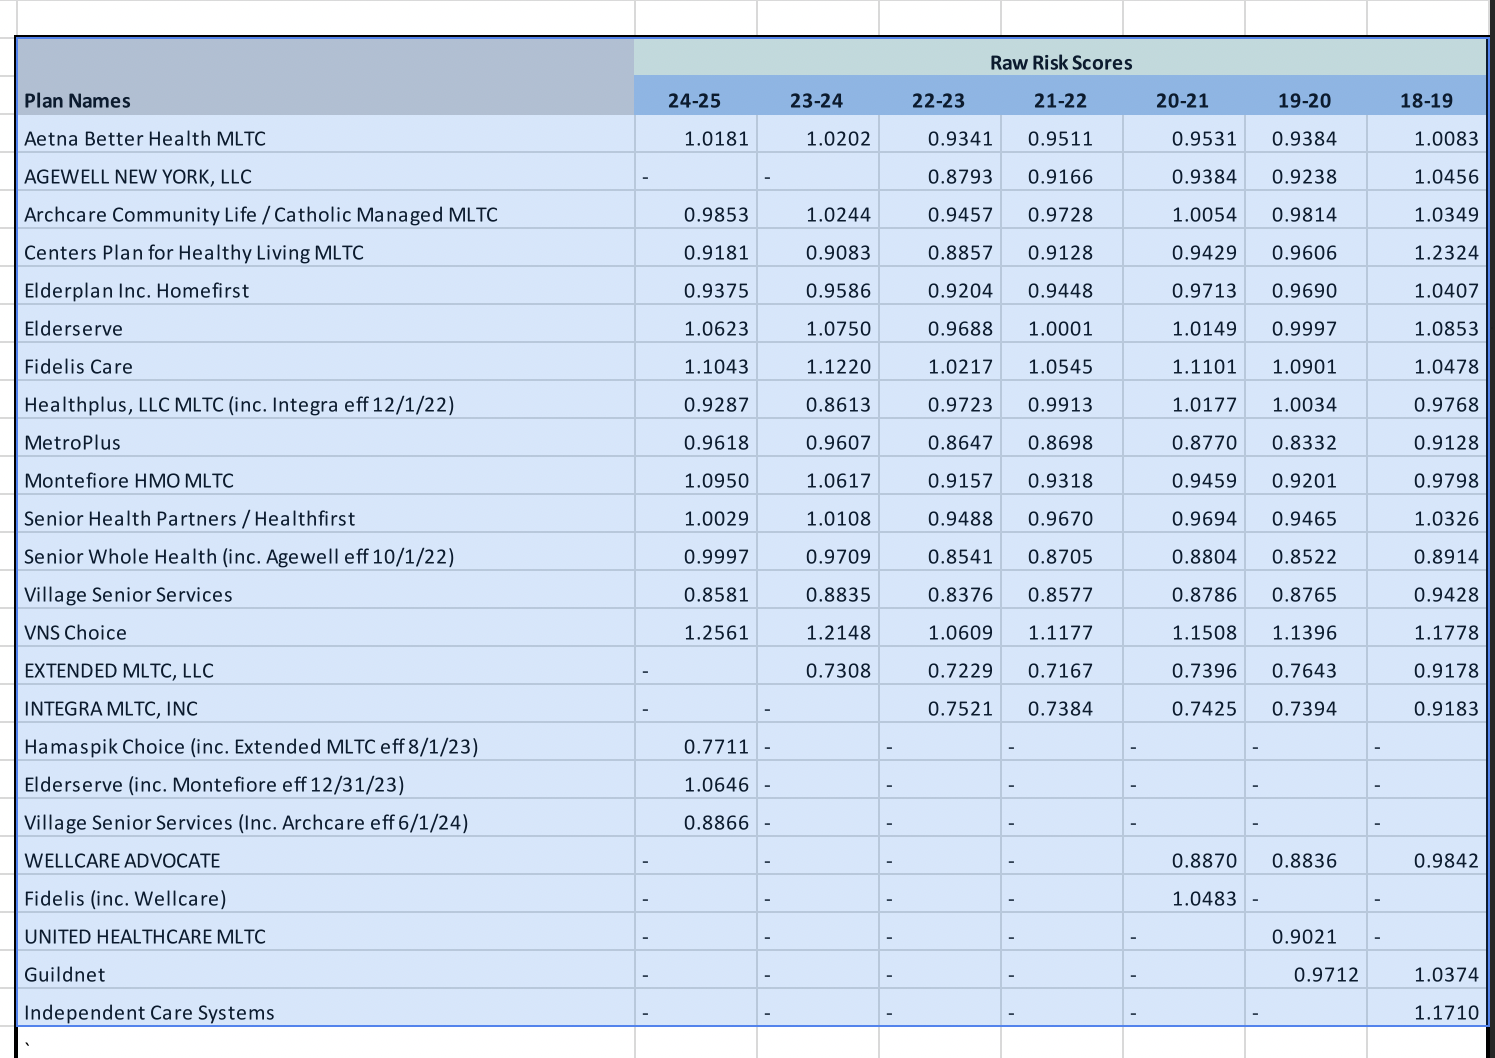
Question: Make a line graph with the data provided with the Plan Names on the left and the Years on the bottom. This line graph should
Make a line graph with the data provided with the Plan Names on the left and the Years on the bottom. This line graph should how between every year each Plan Name's Raw Risk Score changes,
Step by Step Solution
There are 3 Steps involved in it
1 Expert Approved Answer
Step: 1 Unlock

Question Has Been Solved by an Expert!
Get step-by-step solutions from verified subject matter experts
Step: 2 Unlock
Step: 3 Unlock