

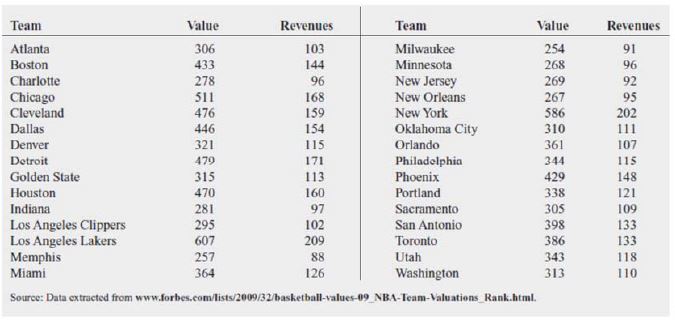
Question: Make a Scatter Plot in MS Excel for the two variables, revenues and values. (Hint: First, determine the independent variable and dependent variable. Then, for
Make a Scatter Plot in MS Excel for the two variables, revenues and values. (Hint: First,
determine the independent variable and dependent variable. Then, for each team, plot the
independent variables on the x?axis and the dependent variables on the y?axis)
What does the scatter plot say? Is there any relationship between these two variables? How?
\f
Step by Step Solution
There are 3 Steps involved in it
1 Expert Approved Answer
Step: 1 Unlock

Question Has Been Solved by an Expert!
Get step-by-step solutions from verified subject matter experts
Step: 2 Unlock
Step: 3 Unlock