

Question: Make a Sensitivity analysis graph. An example will be on imag Example of sensitivitye . Background: Shrieves Casting Company is considering adding a new line
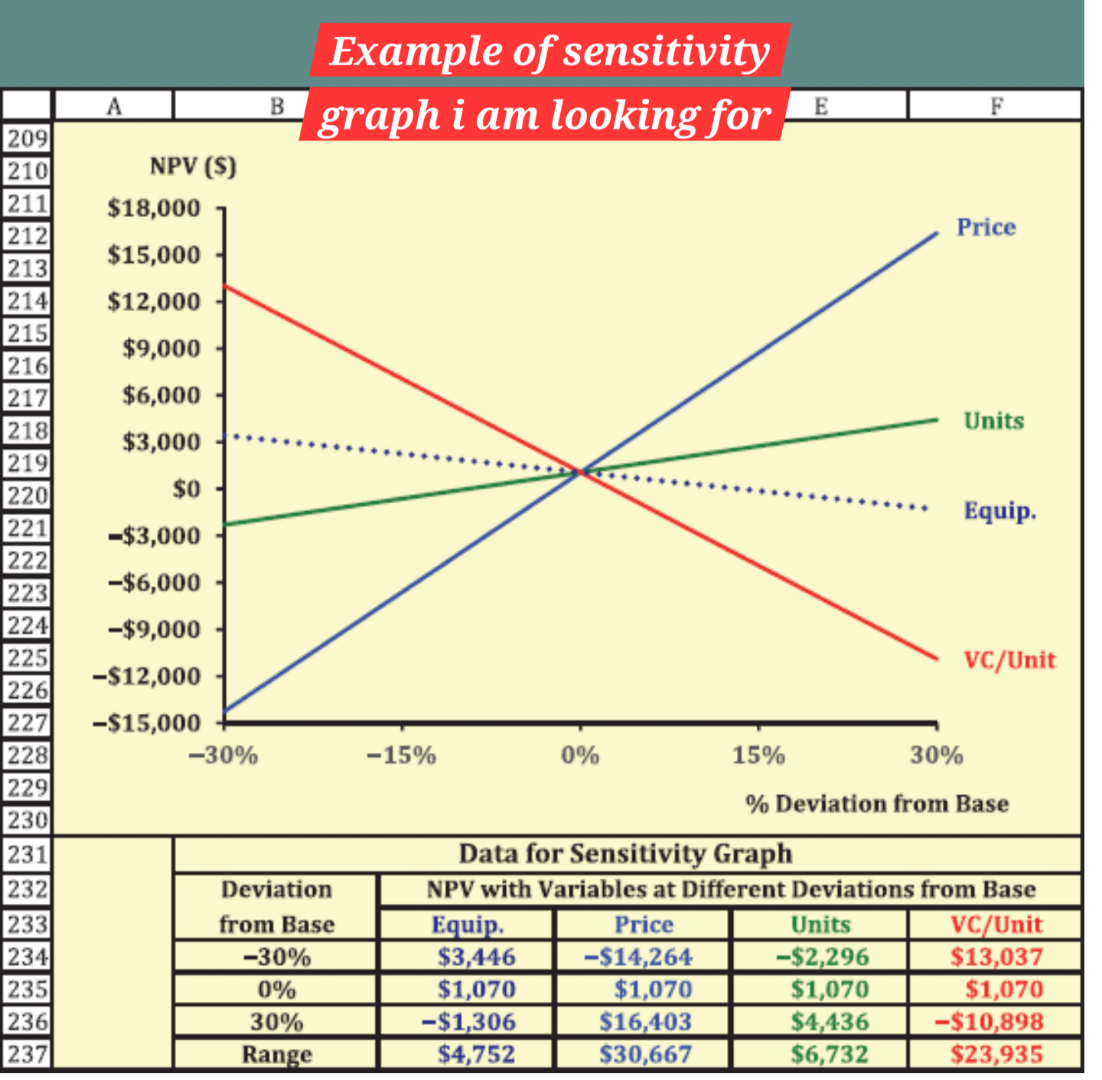
Make a Sensitivity analysis graph. An example will be on imag
Example of sensitivitye
Background:
Shrieves Casting Company is considering adding a new line to its product mix, and the capital budgeting analysis is being conducted by Sidney Johnson, a recently graduated MBA. The production line would be set up in unused space in the main plant. The machinerys invoice price would be approximately $ another $ in shipping charges would be required, and it would cost an additional $ to install the equipment. The machinery has an economic life of years, and Shrieves has obtained a special tax ruling that places the equipment in the MACRS year class. The machinery is expected to have a salvage value of $ after years of use.
The new line would generate incremental sales of units per year for years at an incremental cost of $ per unit in the first year, excluding depreciation. Each unit can be sold for $ in the first year. The sales price and cost are both expected to increase by per year due to inflation. Further, to handle the new line, the firms net working capital would have to increase by an amount equal to of sales revenues. The firms tax rate is and its overall weighted average cost of capital, which is the riskadjusted cost of capital for an average project r is
Step by Step Solution
There are 3 Steps involved in it
1 Expert Approved Answer
Step: 1 Unlock

Question Has Been Solved by an Expert!
Get step-by-step solutions from verified subject matter experts
Step: 2 Unlock
Step: 3 Unlock