

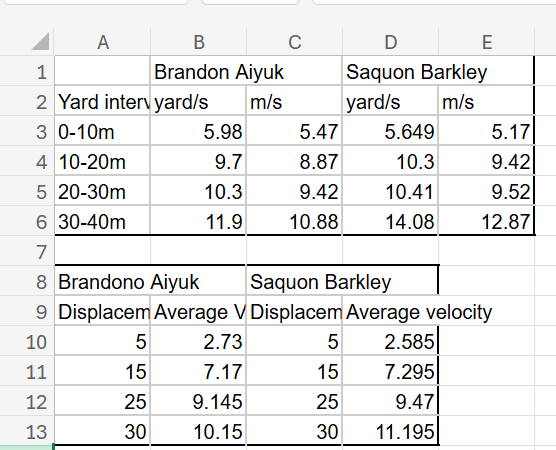
Question: Make a velocity vs . displacement graph ( in Excel is fine, or whatever software you prefer ) , which plots average velocity ( in
Make a velocity vs displacement graph in Excel is fine, or whatever software you prefer which plots average velocity in ms only on the yaxis and displacement in yards on the xaxis. Please make one graph that includes both players. see instructions belowDont worry, its okay in this instance to mix our units. Because we are calculating average velocity for a given interval of distance yard increments the average velocity is typically assigned to the midpoint of the interval yards In other words, the average velocity between yard and yard would be drawn at yard in the velocity vs displacement graph.
To plot both players on the same graph, highlight the x and y data, arranged in two vertical columns. Then click insertchartscatter and select the lines you prefer to connect them. Then arrange the data for the other player in another vertical column. Right click on your chart and select "select data". Go to "legend entries" and select "add". Title your new data set Saquon or Brandon select the SAME series X values as the previous trendline distance in yards and select the new data set for the series Y values. From here, select OK to check out of everything, and you should have both trends on a single plot.
Now plot a velocity vs time graph, with you first datapoint of ms at time Make one graph with both players data on it
Step by Step Solution
There are 3 Steps involved in it
1 Expert Approved Answer
Step: 1 Unlock

Question Has Been Solved by an Expert!
Get step-by-step solutions from verified subject matter experts
Step: 2 Unlock
Step: 3 Unlock