

Question: Make an appropriate data presentation for the following items. You can use MS Excel. Provide a short yet informative interpretation of the graph. 1. (Brase
Make an appropriate data presentation for the following items. You can use MS Excel. Provide a short yet informative interpretation of the graph.
1. (Brase & Brase, p. 55 ) Driving would be more pleasant if we did not have to put up with the bad habits of other drivers. USA Today reported the results of Valvoline Oil Company survey of 500 drivers in which the drivers marked their complaints about other drivers. The top complaints turned out to be tailgating, marked by 22% of the respondents; not using turn signals, marked by 19%; being cut off, marked by 16%; other drivers driving too slowly, marked by 11%; and other drivers being inconsiderate, marked by 8%.
2. (Brase & Brase, p. 56 ) How does average height of boys change as boys get older? According to Physician's Handbook, the average heights at different ages are as follows:
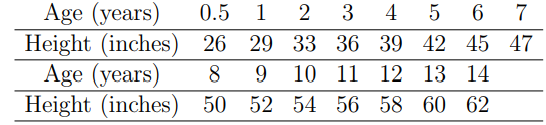
Age years 0.5 - 2 3 4 5 6 7 Height inches 26 29 33 36 39 42 45 47 Age years 8 9 10 11 12 13 14 Height inches 50 52 54 56 58 60 62
Step by Step Solution
There are 3 Steps involved in it

Get step-by-step solutions from verified subject matter experts