

Question: Make box-and-whisker plots for the given data. 1) 17, 29, 32, 9, 30, 14, 8, 39, 11, 32, 23 Minimum : Maximum : Q1 :
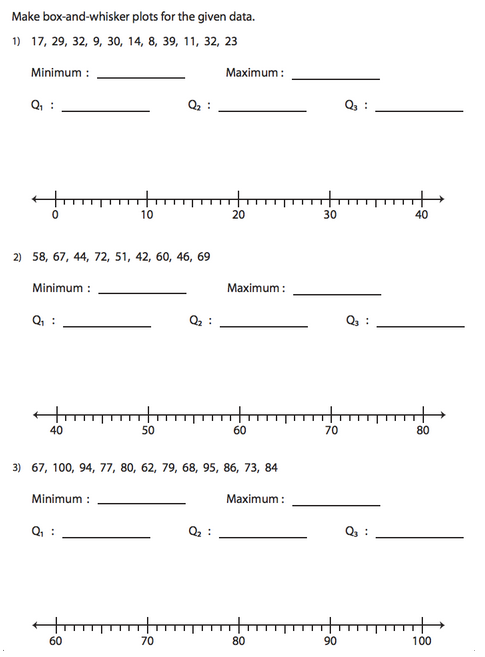
Make box-and-whisker plots for the given data. 1) 17, 29, 32, 9, 30, 14, 8, 39, 11, 32, 23 Minimum : Maximum : Q1 : Of : Q3 : TITT TIT TITT 10 20 30 40 2) 58, 67, 44, 72, 51, 42, 60, 46, 69 Minimum : Maximum : Q1 : Q2 : Q1 : 40 50 60 70 80 3) 67, 100, 94, 77, 80, 62, 79, 68, 95, 86, 73, 84 Minimum : Maximum : Q1 : Q2 : Q, : 60 70 80 90 100
Step by Step Solution
There are 3 Steps involved in it
1 Expert Approved Answer
Step: 1 Unlock

Question Has Been Solved by an Expert!
Get step-by-step solutions from verified subject matter experts
Step: 2 Unlock
Step: 3 Unlock