

Question: Make Excel plots with properly scaled axes Many analytical operations on graphs require that the axes be equally scaled. Measuring the slope of a line
Make Excel plots with properly scaled axes
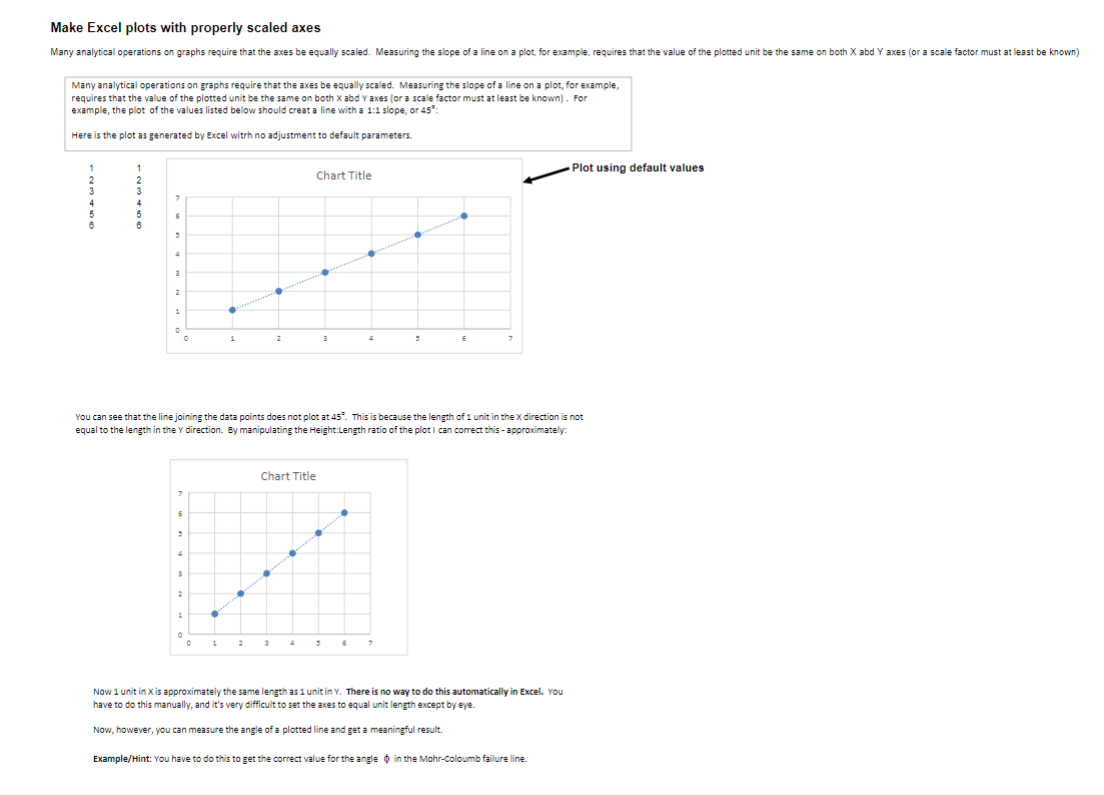
Many analytical operations on graphs require that the axes be equally scaled. Measuring the slope of a line on a plot, for example,
requires that the value of the plotted unit be the same on both abd axes or a scale factor must at least be known For
example, the plot of the values listed below should creat a line with a : slope, or :
Here is the plot as generated by Excel witrh no adjustment to default parameters.
it using default values
You can see that the line joining the data points does not plot at This is because the length of unit in the direction is not
equal to the length in the direction. By manipulating the Height:Length ratio of the plot I can correct this approximately.
Now unit in is approximately the same length as unit in There is no way to do this automatically in Excel. You
have to do this manually, and it's very difficult to set the axes to equal unit length except by eye.
Now, however, you can measure the angle of a plotted line and get a meaningful result.
ExampleHint: You have to do this to get the correct value for the angle in the MohrColoumb failure line.
Step by Step Solution
There are 3 Steps involved in it
1 Expert Approved Answer
Step: 1 Unlock

Question Has Been Solved by an Expert!
Get step-by-step solutions from verified subject matter experts
Step: 2 Unlock
Step: 3 Unlock