

Question: make MQL5 indicator do the following function: it finds support and resistance points and pivot point at a certain time frame using the following functions:
make MQL5 indicator do the following function: 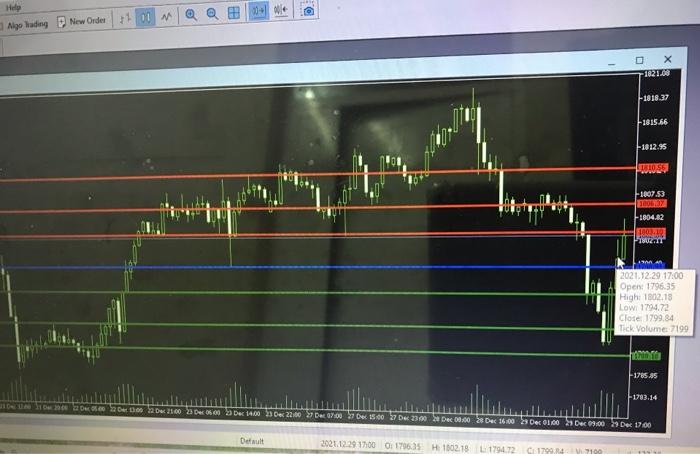
it finds support and resistance points and pivot point at a certain time frame using the following functions:
P=(H+L+C)/3
R1=(P*2)-L
S1=(P*2)-H
R2=P+(R1-S1)
S2=P-(R1-S1)
R3=R1+(H-L)
S3=S1-(H-L)
R1=(P*2)-L
S1=(P*2)-H
R2=P+(R1-S1)
S2=P-(R1-S1)
R3=R1+(H-L)
S3=S1-(H-L)
where p is pivot point, h is high, L is low, C is close, R is resistance, S is support .
The volumes of H,L and C, should be taken from the previous candle (The candle before the last one)
after it finds the points ( P, R1,S1,R2,S2,R3,S3), it should make a horizontal line on the chart for each of points. As shown in the picture
D. Hely Aipolading New Order 1 01 -1021.00 -1818.37 +1815.66 1012.95 W.055 1807.53 1804.82 1003.12 TUOTT 49 2021.12:29 17:00 Openi 1796.35 High: 1802.15 Lowi 1794.72 Close 1799.34 Tick Volume 7199 1785.95 1703.14 wawe D2100 Dec 08.00 Dec 14000 22:00 07:00 15:00 27 Dec 23:00 Dec 00.00 28 Dec 16:00 Dec 01,00 Dec 09,00 De 1.00 Denult 2021.12.29 17:00 O: 1796.35 H 102.18 L 1794.72 1799847199
Step by Step Solution
There are 3 Steps involved in it
1 Expert Approved Answer
Step: 1 Unlock

Question Has Been Solved by an Expert!
Get step-by-step solutions from verified subject matter experts
Step: 2 Unlock
Step: 3 Unlock