

Question: make own data Create Pivot Tables to find 1. The number of players from Toronto and Vancouver and the positions they played. 2. Mode Age
make own data 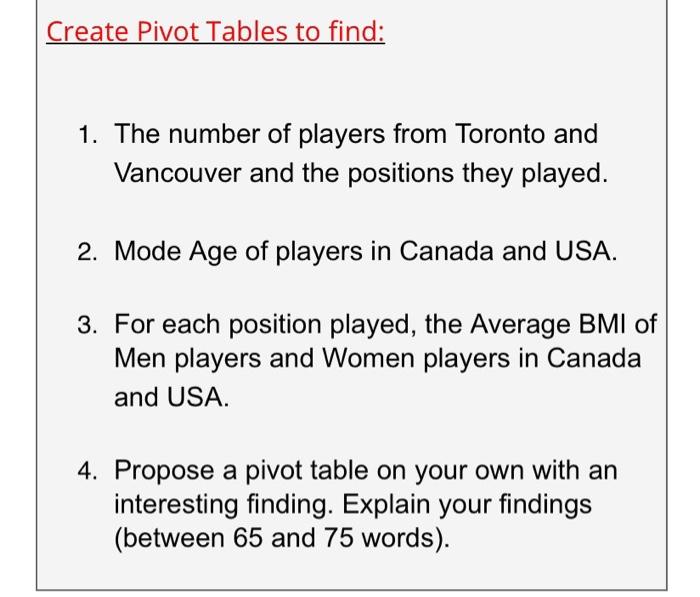
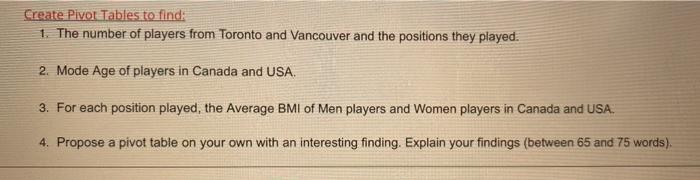
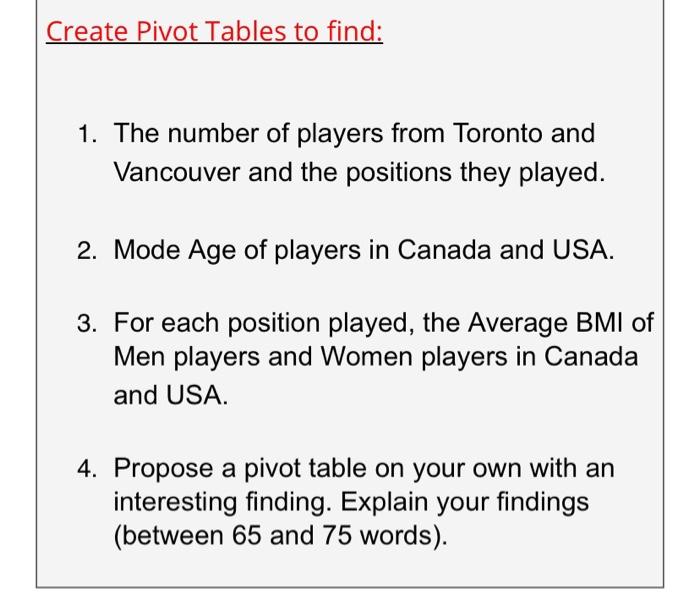
Create Pivot Tables to find 1. The number of players from Toronto and Vancouver and the positions they played. 2. Mode Age of players in Canada and USA. 3. For each position played, the Average BMI of Men players and Women players in Canada and USA. 4. Propose a pivot table on your own with an interesting finding. Explain your findings (between 65 and 75 words). Create Pivot Tables to find: 1. The number of players from Toronto and Vancouver and the positions they played. 2. Mode Age of players in Canada and USA. 3. For each position played, the Average BMI of Men players and Women players in Canada and USA. 4. Propose a pivot table on your own with an interesting finding. Explain your findings (between 65 and 75 words). Create Pivot Tables to find: 1. The number of players from Toronto and Vancouver and the positions they played. 2. Mode Age of players in Canada and USA. 3. For each position played, the Average BMI of Men players and Women players in Canada and USA. 4. Propose a pivot table on your own with an interesting finding. Explain your findings (between 65 and 75 words). Create Pivot Tables to find 1. The number of players from Toronto and Vancouver and the positions they played. 2. Mode Age of players in Canada and USA. 3. For each position played, the Average BMI of Men players and Women players in Canada and USA. 4. Propose a pivot table on your own with an interesting finding. Explain your findings (between 65 and 75 words). Create Pivot Tables to find: 1. The number of players from Toronto and Vancouver and the positions they played. 2. Mode Age of players in Canada and USA. 3. For each position played, the Average BMI of Men players and Women players in Canada and USA. 4. Propose a pivot table on your own with an interesting finding. Explain your findings (between 65 and 75 words). Create Pivot Tables to find: 1. The number of players from Toronto and Vancouver and the positions they played. 2. Mode Age of players in Canada and USA. 3. For each position played, the Average BMI of Men players and Women players in Canada and USA. 4. Propose a pivot table on your own with an interesting finding. Explain your findings (between 65 and 75 words)
Step by Step Solution
There are 3 Steps involved in it
1 Expert Approved Answer
Step: 1 Unlock

Question Has Been Solved by an Expert!
Get step-by-step solutions from verified subject matter experts
Step: 2 Unlock
Step: 3 Unlock