

Question: Make plot using R Studio Consider ARMA(1, 1) model x_t = -0.5x_t-1 + w_t + 0.4w_t - 1. Assume that the noise w_t has variance
Make plot using R Studio
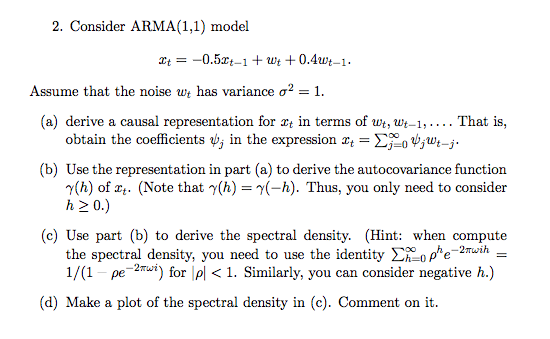
Consider ARMA(1, 1) model x_t = -0.5x_t-1 + w_t + 0.4w_t - 1. Assume that the noise w_t has variance sigma^2 = 1. (a) derive a causal representation for x_t in terms of w_t, w_t-1, .... That is, obtain the coefficients psi_3 in the expression x_t = sigma^infinity_j=0 psi_j w_t-3. Use the representation in part (a) to derive the autocovariance function gamma(h) of x_t. (Note that gamma(h) = gamma(-h). Thus, you only need to consider h greaterthanorequalto 0.) (c) Use part (b) to derive the spectral density. (d) Make a plot of the spectral density in (c). Comment on it. Consider ARMA(1, 1) model x_t = -0.5x_t-1 + w_t + 0.4w_t - 1. Assume that the noise w_t has variance sigma^2 = 1. (a) derive a causal representation for x_t in terms of w_t, w_t-1, .... That is, obtain the coefficients psi_3 in the expression x_t = sigma^infinity_j=0 psi_j w_t-3. Use the representation in part (a) to derive the autocovariance function gamma(h) of x_t. (Note that gamma(h) = gamma(-h). Thus, you only need to consider h greaterthanorequalto 0.) (c) Use part (b) to derive the spectral density. (d) Make a plot of the spectral density in (c). Comment on it
Step by Step Solution
There are 3 Steps involved in it

Get step-by-step solutions from verified subject matter experts