

Question: MAKE SSPS USING DATA BELOW In EXCEL: Make a Figure (bar graph or scatterplot) of your means In SPSS: Run analysis to compare groups (using
MAKE SSPS USING DATA BELOW
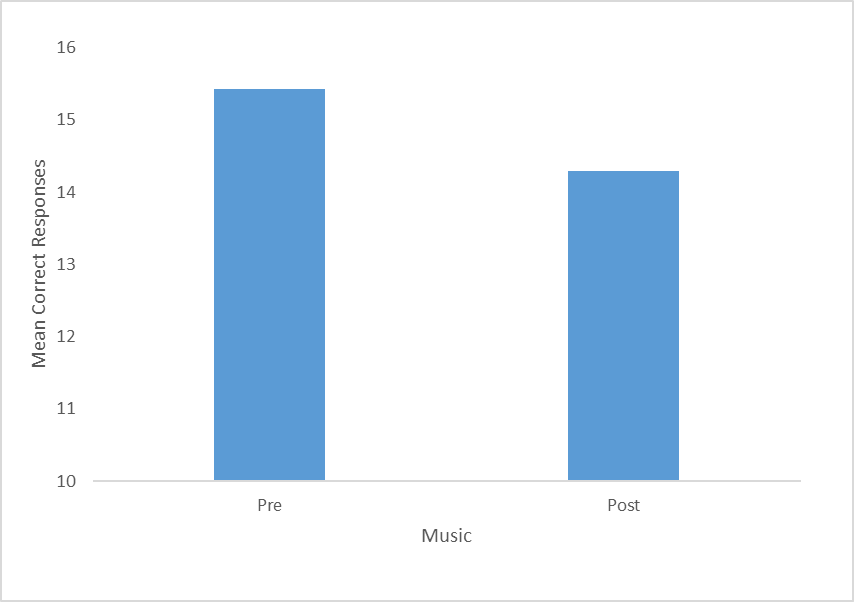
- In EXCEL: Make a Figure (bar graph or scatterplot) of your means
- In SPSS: Run analysis to compare groups (using a correlation or t-test) with means and standard deviations in output in SPSS
- Include and upload of your SPSS output.
- Write results section PARAGRAPH
- The type of analysis you ran (t-test, Pearson correlation)
- Your alpha level
- A description of the outcome in "plain English"
- The means and standard deviation
- Your significance test in the correct format
- A scatterplot or bar graph of the results in AP(A) format
Turn in the Results section and SPSS output
DATA:
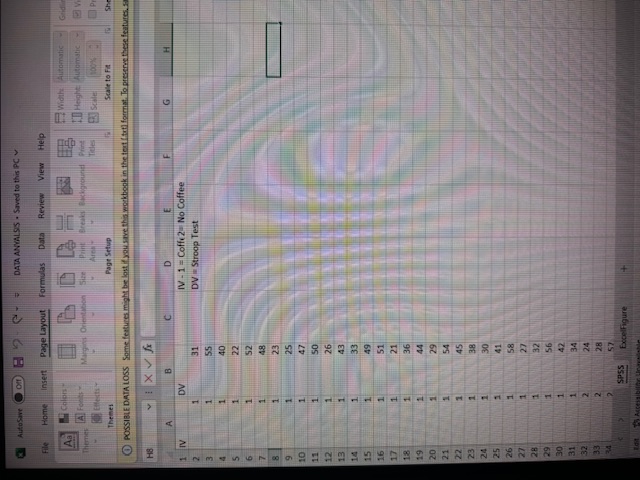
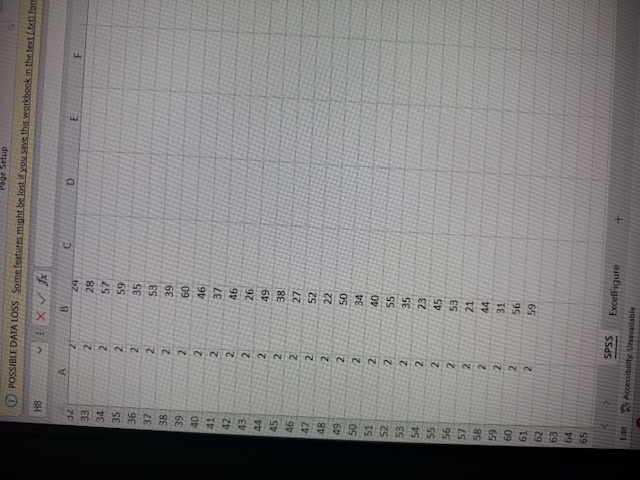
DATA ANYALSS - Saved to this PC File Home Insert Page Layout Formulas Data Review View Help Width Automatic SIFF ED Height Automatic P Themes Page Setup Schir to Fa Q) POSSIBLE DATA LOSS Some features might be last if you save this workbook in the feat ! tell format. To preserve these features. HE I X VI A B C D E F G H DV IV - 1 = Coffey No Coffee 31 DV - Stroop Test 55 40 22 52 24 ExcelFigureQ)POSSIBLE DATA LOSS Some features might be lost if you save this workbook in the text (.tall for HB C D A B 2 28 57 34 2 35 2 36 NN 37 38 39 40 41 NN N N N N N N N N NN NN NN NN NN NNNN 64 SPSS ExcelFigure Ed Wa Accessibility Unavailable\f
Step by Step Solution
There are 3 Steps involved in it

Get step-by-step solutions from verified subject matter experts