

Question: ** Make sure to add the comments to describe your codes. Additional function files should be uploaded with the submission. The figures should have proper
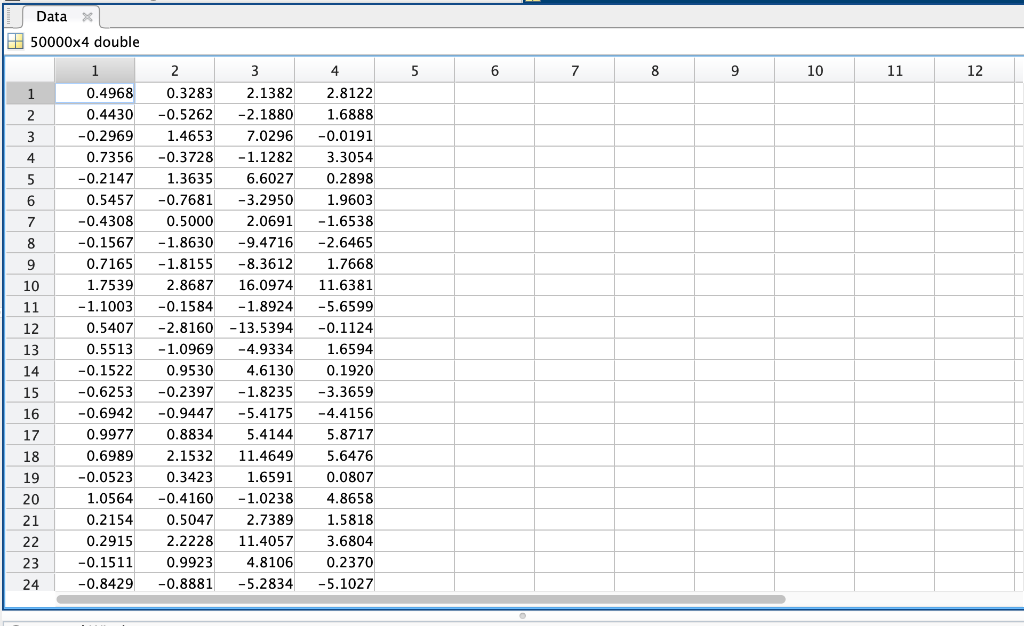
** Make sure to add the comments to describe your codes. Additional function files should be uploaded with the submission. The figures should have proper labels. The file 'Assign2.mat' (found in canvas Files>Assignment2) contains an array named 'Data'. The array 'Data' contains signals x1,x2,x3 and 4 saved in each column. 1. (5 pts) Load the file 'Assign2.mat' into MATLAB and plot the signal x1,x2,x3 and 4 on the same figure, considering a sampling frequency of 1000 Hz. Use 4 subplots to plot the 4 signals and add titles to each subplot. * your code here 2. (5 pts) Estimate the expected value of the second half of x1 using the fist half of the signal. Calculate the bias between the expected value and the mean of the second half of the signal. Plot the second half of the signal and the calculated expected values. Also, plot the estimated upper limit and lower limit of the signal based on the standard deviation. & code here 3. (2 pts) Create a function to calculate the correlation coefficient between two signals. You should upload the .m file for the function file with your submission. 4. (3 pts) Use the function created in 2. and find which signal pairs are similar from x1,x2 x3 x4. 8 code here 5. (5 pts)Create a function to calculate the histogram of a random signal. Inputs: signal and number of bins. output: x axis values and y axis value of the histogram. Use the created function to plot the histograms of x1 and x2. Use 100 bins. % code here, use bar plots to plot the histogram What type of probability distribution is seen from the histogram plots? Data X 50000x4 double 4 5 6 7 8 9 10 11 12 1 2 3 4 5 6 7 8 9 10 11 12 13 14 15 16 17 18 19 20 1 0.4968 0.4430 -0.2969 0.7356 -0.2147 0.5457 -0.4308 -0.1567 0.7165 1.7539 - 1.1003 0.5407 0.5513 -0.1522 -0.6253 -0.6942 0.9977 0.6989 -0.0523 1.0564 0.2154 0.2915 -0.1511 -0.8429 2 3 0.3283 2.1382 -0.5262 -2.1880 1.4653 7.0296 -0.3728 -1.1282 1.3635 6.6027 -0.7681 -3.2950 0.5000 2.0691 -1.8630 -9.4716 - 1.8155 -8.3612 2.8687 16.0974 -0.1584 -1.8924 -2.8160 -13.5394 -1.0969 -4.9334 0.9530 4.6130 -0.2397 -1.8235 -0.9447 -5.4175 0.8834 5.4144 2.1532 11.4649 0.3423 1.6591 -0.4160 - 1.0238 0.5047 2.7389 2.2228 11.4057 0.9923 4.8106 -0.8881 -5.2834 2.8122 1.6888 -0.0191 3.3054 0.2898 1.9603 -1.6538 -2.6465 1.7668 11.6381 -5.6599 -0.1124 1.6594 0.1920 -3.3659 -4.4156 5.8717 5.6476 0.0807 4.8658 1.5818 3.6804 0.2370 -5.1027 21 22 23 24 ** Make sure to add the comments to describe your codes. Additional function files should be uploaded with the submission. The figures should have proper labels. The file 'Assign2.mat' (found in canvas Files>Assignment2) contains an array named 'Data'. The array 'Data' contains signals x1,x2,x3 and 4 saved in each column. 1. (5 pts) Load the file 'Assign2.mat' into MATLAB and plot the signal x1,x2,x3 and 4 on the same figure, considering a sampling frequency of 1000 Hz. Use 4 subplots to plot the 4 signals and add titles to each subplot. * your code here 2. (5 pts) Estimate the expected value of the second half of x1 using the fist half of the signal. Calculate the bias between the expected value and the mean of the second half of the signal. Plot the second half of the signal and the calculated expected values. Also, plot the estimated upper limit and lower limit of the signal based on the standard deviation. & code here 3. (2 pts) Create a function to calculate the correlation coefficient between two signals. You should upload the .m file for the function file with your submission. 4. (3 pts) Use the function created in 2. and find which signal pairs are similar from x1,x2 x3 x4. 8 code here 5. (5 pts)Create a function to calculate the histogram of a random signal. Inputs: signal and number of bins. output: x axis values and y axis value of the histogram. Use the created function to plot the histograms of x1 and x2. Use 100 bins. % code here, use bar plots to plot the histogram What type of probability distribution is seen from the histogram plots? Data X 50000x4 double 4 5 6 7 8 9 10 11 12 1 2 3 4 5 6 7 8 9 10 11 12 13 14 15 16 17 18 19 20 1 0.4968 0.4430 -0.2969 0.7356 -0.2147 0.5457 -0.4308 -0.1567 0.7165 1.7539 - 1.1003 0.5407 0.5513 -0.1522 -0.6253 -0.6942 0.9977 0.6989 -0.0523 1.0564 0.2154 0.2915 -0.1511 -0.8429 2 3 0.3283 2.1382 -0.5262 -2.1880 1.4653 7.0296 -0.3728 -1.1282 1.3635 6.6027 -0.7681 -3.2950 0.5000 2.0691 -1.8630 -9.4716 - 1.8155 -8.3612 2.8687 16.0974 -0.1584 -1.8924 -2.8160 -13.5394 -1.0969 -4.9334 0.9530 4.6130 -0.2397 -1.8235 -0.9447 -5.4175 0.8834 5.4144 2.1532 11.4649 0.3423 1.6591 -0.4160 - 1.0238 0.5047 2.7389 2.2228 11.4057 0.9923 4.8106 -0.8881 -5.2834 2.8122 1.6888 -0.0191 3.3054 0.2898 1.9603 -1.6538 -2.6465 1.7668 11.6381 -5.6599 -0.1124 1.6594 0.1920 -3.3659 -4.4156 5.8717 5.6476 0.0807 4.8658 1.5818 3.6804 0.2370 -5.1027 21 22 23 24
Step by Step Solution
There are 3 Steps involved in it

Get step-by-step solutions from verified subject matter experts