

Question: Make sure to document your work: do not merely give a solution without adequate explanations and intermediate steps necessary to obtain the results. You will
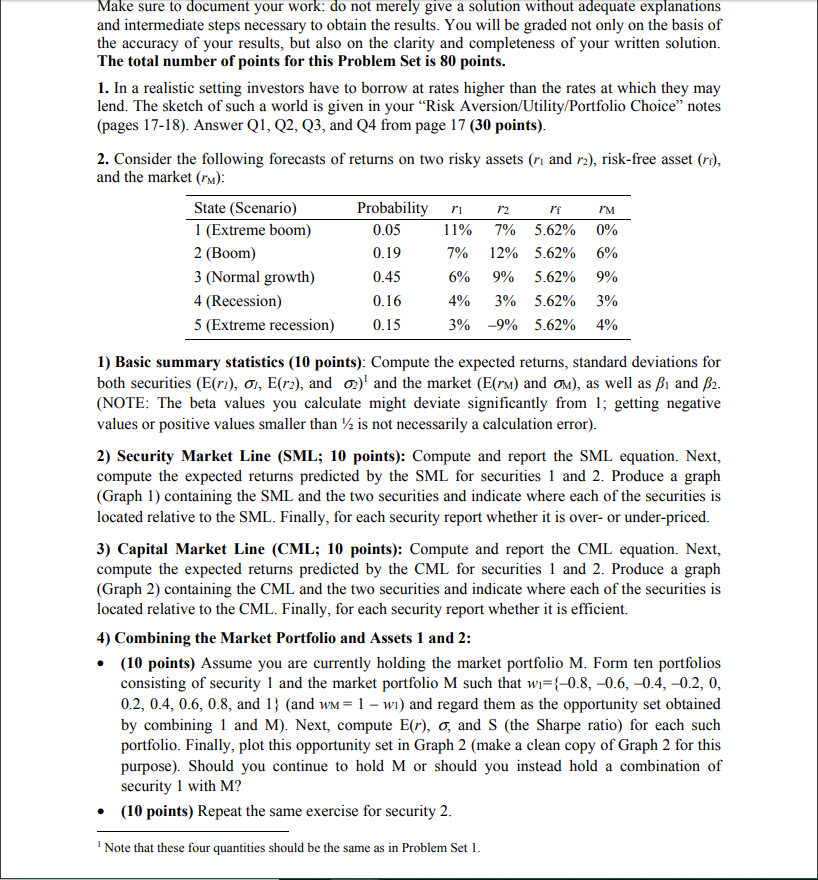
Make sure to document your work: do not merely give a solution without adequate explanations and intermediate steps necessary to obtain the results. You will be graded not only on the basis of the accuracy of your results, but also on the clarity and completeness of your written solution. The total number of points for this Problem Set is 80 points. 1. In a realistic setting investors have to borrow at rates higher than the rates at which they may lend. The sketch of such a world is given in your "Risk Aversion/Utility/Portfolio Choice notes (pages 17-18). Answer Q1, Q2, Q3, and Q4 from page 17 (30 points). 2. Consider the following forecasts of returns on two risky assets (n and r2), risk-free asset (re), and the market (rm): State (Scenario) Probability i n rf PM 1 (Extreme boom) 0.05 11% 7% 5.62% 0% 2 (Boom) 0.19 7 % 12% 5.62% 6% 3 (Normal growth) 0.45 6 % 9% 5.62% 9% 4 (Recession) 0.16 4% 3% 5.62% 3% 5 (Extreme recession) 0.15 3 % -9% 5.62% 4% 1) Basic summary statistics (10 points): Compute the expected returns, standard deviations for both securities (E(ri), 01, E(r2), and o) and the market (E(rm) and om), as well as B1 and B2. (NOTE: The beta values you calculate might deviate significantly from 1; getting negative values or positive values smaller than 2 is not necessarily a calculation error). 2) Security Market Line (SML; 10 points): Compute and report the SML equation. Next, compute the expected returns predicted by the SML for securities 1 and 2. Produce a graph (Graph 1) containing the SML and the two securities and indicate where each of the securities is located relative to the SML. Finally, for each security report whether it is over- or under-priced. 3) Capital Market Line (CML; 10 points): Compute and report the CML equation. Next, compute the expected returns predicted by the CML for securities 1 and 2. Produce a graph (Graph 2) containing the CML and the two securities and indicate where each of the securities is located relative to the CML. Finally, for each security report whether it is efficient. 4) Combining the Market Portfolio and Assets 1 and 2: (10 points) Assume you are currently holding the market portfolio M. Form ten portfolios consisting of security 1 and the market portfolio M such that wi={-0.8, -0.6,-0.4,-0.2, 0, 0.2, 0.4, 0.6, 0.8, and 1} (and wm= 1 - wi) and regard them as the opportunity set obtained by combining 1 and M). Next, compute E(r), o, and S (the Sharpe ratio) for each such portfolio. Finally, plot this opportunity set in Graph 2 (make a clean copy of Graph 2 for this purpose). Should you continue to hold M or should you instead hold a combination of security 1 with M? (10 points) Repeat the same exercise for security 2. Note that these four quantities should be the same as in Problem Set I. Make sure to document your work: do not merely give a solution without adequate explanations and intermediate steps necessary to obtain the results. You will be graded not only on the basis of the accuracy of your results, but also on the clarity and completeness of your written solution. The total number of points for this Problem Set is 80 points. 1. In a realistic setting investors have to borrow at rates higher than the rates at which they may lend. The sketch of such a world is given in your "Risk Aversion/Utility/Portfolio Choice notes (pages 17-18). Answer Q1, Q2, Q3, and Q4 from page 17 (30 points). 2. Consider the following forecasts of returns on two risky assets (n and r2), risk-free asset (re), and the market (rm): State (Scenario) Probability i n rf PM 1 (Extreme boom) 0.05 11% 7% 5.62% 0% 2 (Boom) 0.19 7 % 12% 5.62% 6% 3 (Normal growth) 0.45 6 % 9% 5.62% 9% 4 (Recession) 0.16 4% 3% 5.62% 3% 5 (Extreme recession) 0.15 3 % -9% 5.62% 4% 1) Basic summary statistics (10 points): Compute the expected returns, standard deviations for both securities (E(ri), 01, E(r2), and o) and the market (E(rm) and om), as well as B1 and B2. (NOTE: The beta values you calculate might deviate significantly from 1; getting negative values or positive values smaller than 2 is not necessarily a calculation error). 2) Security Market Line (SML; 10 points): Compute and report the SML equation. Next, compute the expected returns predicted by the SML for securities 1 and 2. Produce a graph (Graph 1) containing the SML and the two securities and indicate where each of the securities is located relative to the SML. Finally, for each security report whether it is over- or under-priced. 3) Capital Market Line (CML; 10 points): Compute and report the CML equation. Next, compute the expected returns predicted by the CML for securities 1 and 2. Produce a graph (Graph 2) containing the CML and the two securities and indicate where each of the securities is located relative to the CML. Finally, for each security report whether it is efficient. 4) Combining the Market Portfolio and Assets 1 and 2: (10 points) Assume you are currently holding the market portfolio M. Form ten portfolios consisting of security 1 and the market portfolio M such that wi={-0.8, -0.6,-0.4,-0.2, 0, 0.2, 0.4, 0.6, 0.8, and 1} (and wm= 1 - wi) and regard them as the opportunity set obtained by combining 1 and M). Next, compute E(r), o, and S (the Sharpe ratio) for each such portfolio. Finally, plot this opportunity set in Graph 2 (make a clean copy of Graph 2 for this purpose). Should you continue to hold M or should you instead hold a combination of security 1 with M? (10 points) Repeat the same exercise for security 2. Note that these four quantities should be the same as in Problem Set
Step by Step Solution
There are 3 Steps involved in it

Get step-by-step solutions from verified subject matter experts