

Question: make sure to fully answer and will give good feedback thanks all pic are just one question ill show the possible answers Can the performance
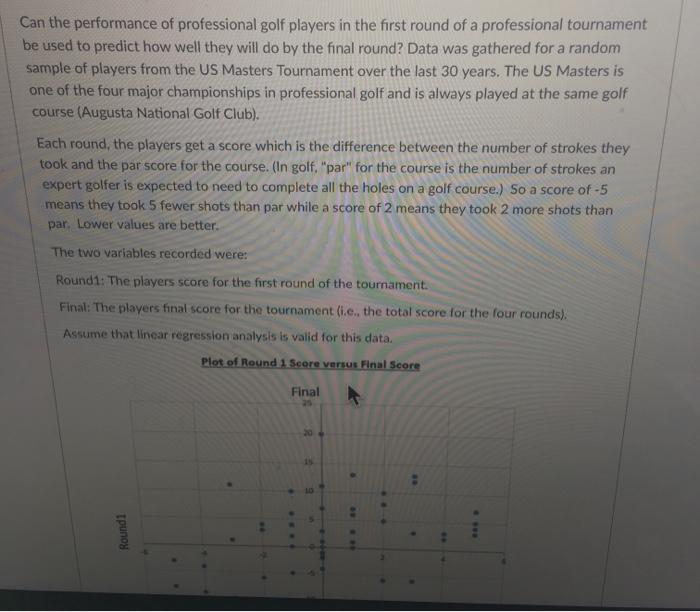
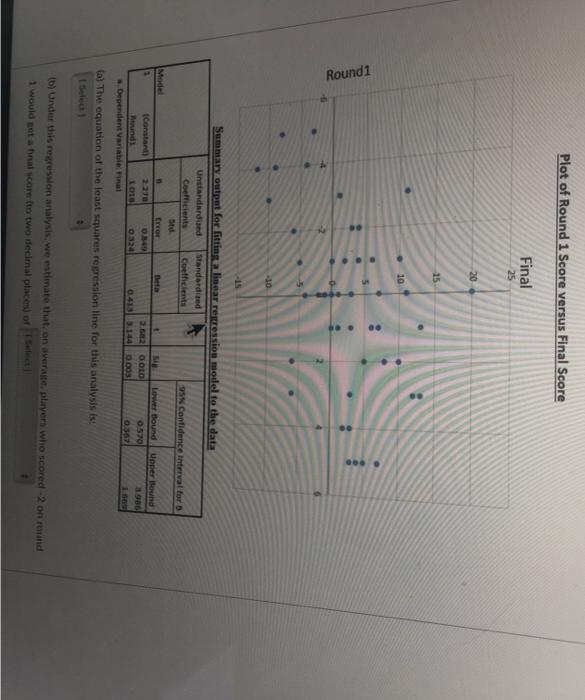
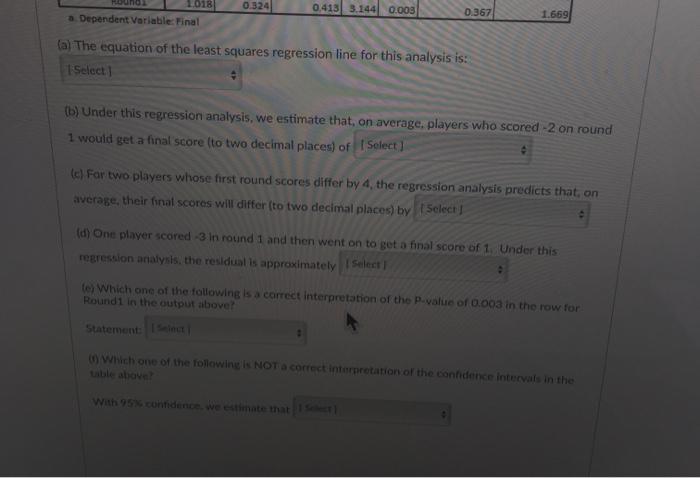
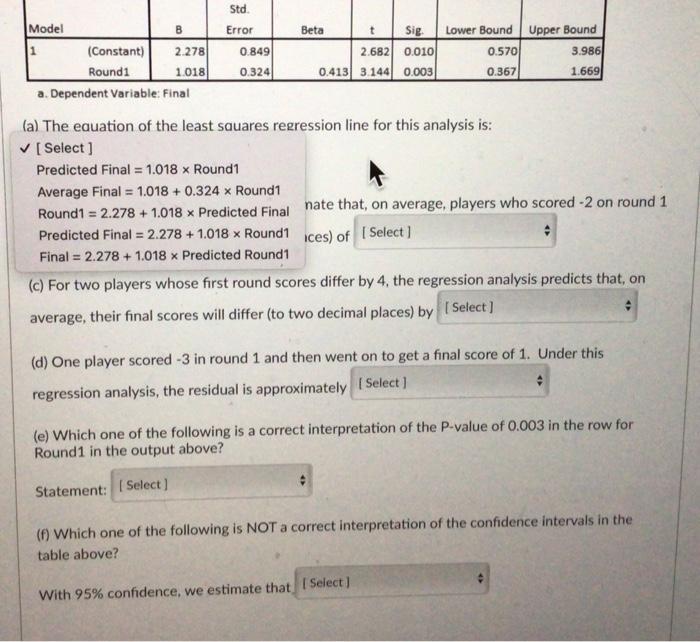
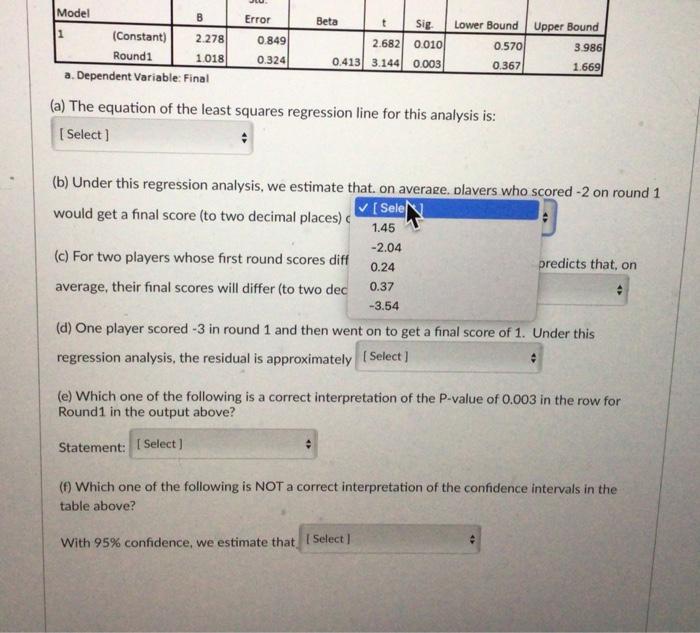
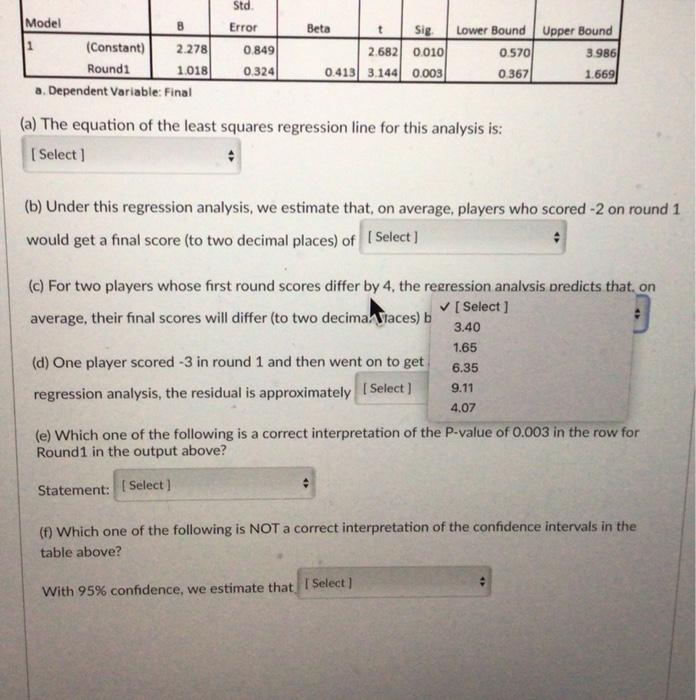
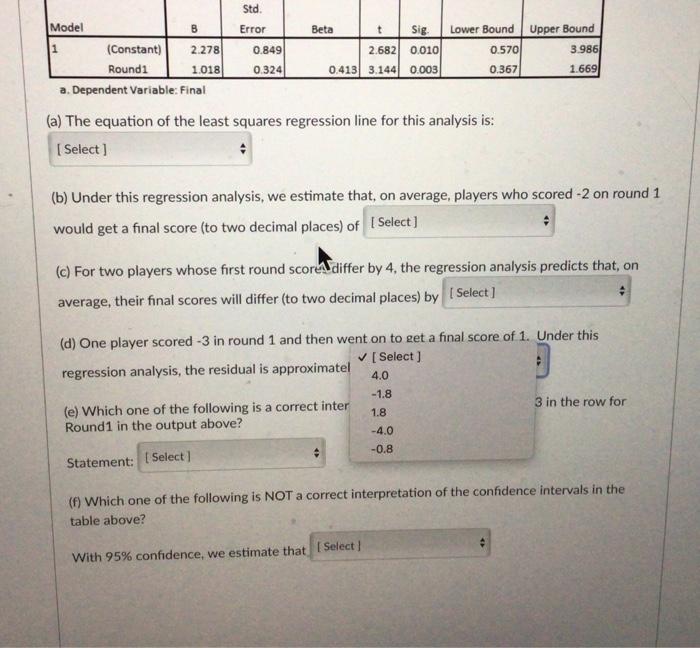
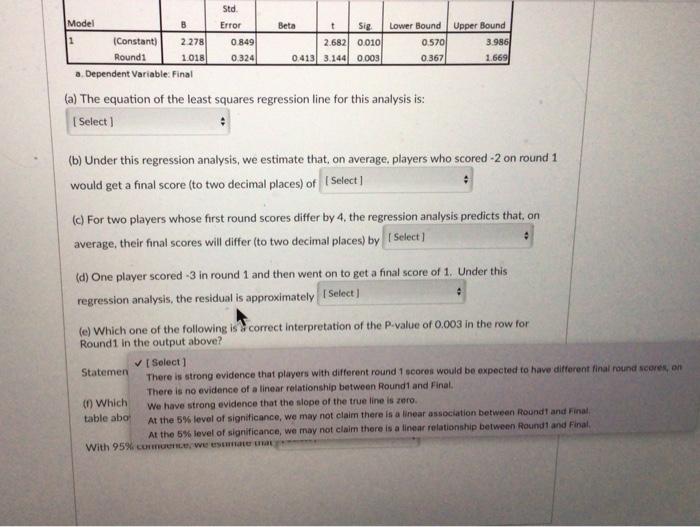

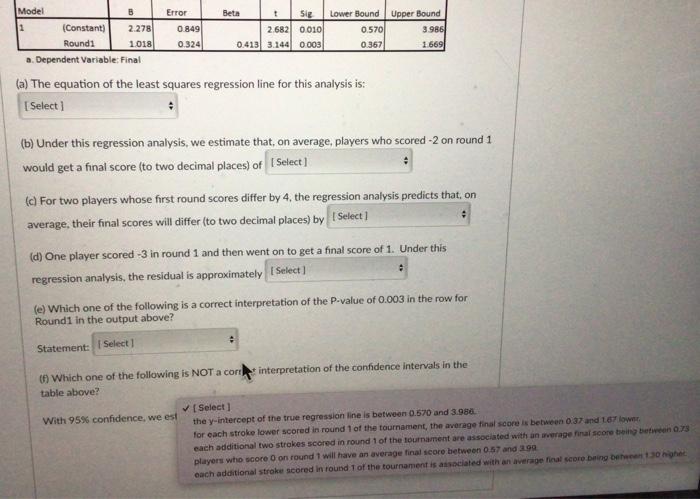
Can the performance of professional golf players in the first round of a professional tournament be used to predict how well they will do by the final round? Data was gathered for a random sample of players from the US Masters Tournament over the last 30 years. The US Masters is one of the four major championships in professional golf and is always played at the same golf course (Augusta National Golf Club). Each round, the players get a score which is the difference between the number of strokes they took and the par score for the course. (In golf, "par" for the course is the number of strokes an expert golfer is expected to need to complete all the holes on a golf course.) So a score of -5 means they took 5 fewer shots than par while a score of 2 means they took 2 more shots than par. Lower values are better. The two variables recorded were: Round1: The players score for the first round of the tournament. Final: The players final score for the tournament (i.e., the total score for the four rounds). Assume that linear regression analysis is valid for this data. Plot of Round 1 Score versus Final Score Final 25 20 Round 1 ** #0 **.* ** Round 1 Plot of Round 1 Score versus Final Score Final 25 20 B Std. Error 10 -40 -15 Summary output for fitting a linear regression model to the data Unstandardized Standardized Coefficients Coefficients 95% Confidence interval for 6 Model n Beta Lower Bound Upper Bound t Sig 2.682 0.010 3 2.278 0.849 0.570 (Constant) Round! 1018 0324 0413 3.144 0.003 0.367 1.500 a. Dependent Variable: Final (a) The equation of the least squares regression line for this analysis is (b) Under this regression analysis, we estimate that, on average, players who scored -2 on round 1 would get a final score (to two decimal places) of Select 1.018 0.324 0.413 3.144 0.003 0.367 1.669 a. Dependent Variable: Final (a) The equation of the least squares regression line for this analysis is: 1 Select] (b) Under this regression analysis, we estimate that, on average, players who scored -2 on round 1 would get a final score (to two decimal places) of [ Select] (c) For two players whose first round scores differ by 4, the regression analysis predicts that, on average, their final scores will differ (to two decimal places) by Select J (d) One player scored -3 in round 1 and then went on to get a final score of 1. Under this regression analysis, the residual is approximately Select] (e) Which one of the following is a correct interpretation of the P-value of 0.003 in the row for Round1 in the output above? Statement: Select (0) Which one of the following is NOT a correct interpretation of the confidence intervals in the table above? With 95% confidence, we estimate that I Select) Std. Error Model t Sig. Upper Bound 1 (Constant) 2.278 0.849 2.682 0.010 0.570 3.986 Round1 1.018 0.324 0.413 3.144 0.003 0.367 1.669 a. Dependent Variable: Final (a) The equation of the least squares regression line for this analysis is: [Select] Predicted Final = 1.018 x Round1 Average Final = 1.018 + 0.324 x Round1 Round1 = 2.278 + 1.018 x Predicted Final Predicted Final = 2.278 + 1.018 x Round1 Final = 2.278 + 1.018 x Predicted Round1 nate that, on average, players who scored -2 on round 1 ices) of [Select] (c) For two players whose first round scores differ by 4, the regression analysis predicts that, on average, their final scores will differ (to two decimal places) by [Select] (d) One player scored -3 in round 1 and then went on to get a final score of 1. Under this regression analysis, the residual is approximately [Select] (e) Which one of the following is a correct interpretation of the P-value of 0.003 in the row for Round1 in the output above? Statement: [Select] (f) Which one of the following is NOT a correct interpretation of the confidence intervals in the table above? With 95% confidence, we estimate that [Select] Beta Lower Bound Model B t Sig. Lower Bound Upper Bound 1 (Constant) 2.278 0.849 2.682 0.010 0.570 3.986 Round1 1.018 0.324 0.413 3.144 0.003 0.367 1.669 a. Dependent Variable: Final (a) The equation of the least squares regression line for this analysis is: [Select] # (b) Under this regression analysis, we estimate that. on average. plavers who scored -2 on round 1 [Sele would get a final score (to two decimal places) ( 1.45 -2.04 predicts that, on 0.24 (c) For two players whose first round scores diff average, their final scores will differ (to two dec 0.37 -3.54 (d) One player scored -3 in round 1 and then went on to get a final score of 1. Under this regression analysis, the residual is approximately [Select] (e) Which one of the following is a correct interpretation of the P-value of 0.003 in the row for Round1 in the output above? Statement: [Select] (f) Which one of the following is NOT a correct interpretation of the confidence intervals in the table above? With 95% confidence, we estimate that [Select] Error Beta Std. Error Model 8 t Sig. Lower Bound Upper Bound 1 (Constant) 2.278 0.849 2.682 0.010 0.570 3.986 Round1 1.018 0.324 0.413 3.144 0.003 0.367 1.669 a. Dependent Variable: Final (a) The equation of the least squares regression line for this analysis is: [Select] (b) Under this regression analysis, we estimate that, on average, players who scored -2 on round 1 would get a final score (to two decimal places) of [Select] (c) For two players whose first round scores differ by 4, the regression analysis predicts that, on average, their final scores will differ (to two decima aces) b [Select] 3.40 1.65 6.35 (d) One player scored -3 in round 1 and then went on to get regression analysis, the residual is approximately [Select] 9.11 4.07 (e) Which one of the following is a correct interpretation of the P-value of 0.003 in the row for Round1 in the output above? Statement: [Select] (f) Which one of the following is NOT a correct interpretation of the confidence intervals in the table above? : With 95% confidence, we estimate that [Select] Beta Std. Error B 2.278 1.018 Model t Sig. Lower Bound Upper Bound 1 (Constant) 0.849 2.682 0.010 0.570 3.986 Round1 0.324 0.413 3.144 0.003 0.367 1.669 a. Dependent Variable: Final (a) The equation of the least squares regression line for this analysis is: [Select] (b) Under this regression analysis, we estimate that, on average, players who scored -2 on round 1 would get a final score (to two decimal places) of [Select] (c) For two players whose first round score differ by 4, the regression analysis predicts that, on average, their final scores will differ (to two decimal places) by [Select] (d) One player scored -3 in round 1 and then went on to get a final score of 1. Under this regression analysis, the residual is approximatel [Select] 4.0 -1.8 3 in the row for (e) Which one of the following is a correct inter Round1 in the output above? 1.8 -4.0 -0.8 Statement: [Select] (f) Which one of the following is NOT a correct interpretation of the confidence intervals in the table above? # With 95% confidence, we estimate that [Select] Beta Std. Error B 2.278 1.018 Model t Sig Lower Bound Upper Bound 1 (Constant) 0.849 2.682 0.010 0.570 3.986 Round1 0.324 0413 3.144 0.003 0.367 1.669 a. Dependent Variable: Final (a) The equation of the least squares regression line for this analysis is: [Select] (b) Under this regression analysis, we estimate that, on average, players who scored -2 on round 1 would get a final score (to two decimal places) of [Select] (c) For two players whose first round scores differ by 4, the regression analysis predicts that, on average, their final scores will differ (to two decimal places) by [Select] 0 (d) One player scored-3 in round 1 and then went on to get a final score of 1. Under this regression analysis, the residual is approximately [Select] (e) Which one of the following is correct interpretation of the P-value of 0.003 in the row for Round 1 in the output above? [Select] Statemen There is strong evidence that players with different round 1 scores would be expected to have different final round scores, on There is no evidence of a linear relationship between Round1 and Final. (f) Which table abo We have strong evidence that the slope of the true line is zero. At the 5% level of significance, we may not claim there is a linear association between Round and Final At the 5% level of significance, we may not claim there is a linear relationship between Round1 and Final. With 95% conmuence, we estimate una Beta Model B t Sig Lower Bound Upper Bound 1 0.849 2.682 0.010 0.570 3.986 (Constant) 2.278 Round1 1.018 0.324 0.413 3.144 0.003 0.367 1.669 a. Dependent Variable: Final (a) The equation of the least squares regression line for this analysis is: [Select] (b) Under this regression analysis, we estimate that, on average, players who scored -2 on round 1 would get a final score (to two decimal places) of [Select] (c) For two players whose first round scores differ by 4, the regression analysis predicts that, on average, their final scores will differ (to two decimal places) by [Select] (d) One player scored -3 in round 1 and then went on to get a final score of 1. Under this regression analysis, the residual is approximately [Select] # (e) Which one of the following is a correct interpretation of the P-value of 0.003 in the row for Round1 in the output above? # Statement: [Select] (f) Which one of the following is NOT a cort interpretation of the confidence intervals in the table above? [Select] With 95% confidence, we est the y-intercept of the true regression line is between 0.570 and 3.986. for each stroke lower scored in round 1 of the tournament, the average final score is between 0.37 and 1.67 lower. each additional two strokes scored in round 1 of the tournament are associated with an average final score being between 0.73 players who score 0 on round 1 will have an average final score between 0.57 and 3.99 each additional stroke scored in round 1 of the tournament is associated with an average final score being between 1.30 higher Error Beta Model B t Sig Lower Bound Upper Bound 1 2.278 0.849 2.682 0.010 0.570 3.986 (Constant) Round1 1.018 0.324 0.413 3.144 0.003 0.367 1.669 a. Dependent Variable: Final (a) The equation of the least squares regression line for this analysis is: [Select] (b) Under this regression analysis, we estimate that, on average, players who scored -2 on round 1 would get a final score (to two decimal places) of [Select] (c) For two players whose first round scores differ by 4, the regression analysis predicts that, on average, their final scores will differ (to two decimal places) by [Select] (d) One player scored -3 in round 1 and then went on to get a final score of 1. Under this regression analysis, the residual is approximately [Select] : (e) Which one of the following is a correct interpretation of the P-value of 0.003 in the row for Round1 in the output above? # Statement: [Select] (f) Which one of the following is NOT a cort interpretation of the confidence intervals in the table above? [Select] With 95% confidence, we est the y-intercept of the true regression line is between 0.570 and 3.986. for each stroke lower scored in round 1 of the tournament, the average final score is between 0.37 and 1.67 lower each additional two strokes scored in round 1 of the tournament are associated with an average final score being between 0.73 players who score 0 on round 1 will have an average final score between 0.57 and 3.99 each additional stroke scored in round 1 of the tournament is associated with an average final score being between 1.30 higher Error Beta Can the performance of professional golf players in the first round of a professional tournament be used to predict how well they will do by the final round? Data was gathered for a random sample of players from the US Masters Tournament over the last 30 years. The US Masters is one of the four major championships in professional golf and is always played at the same golf course (Augusta National Golf Club). Each round, the players get a score which is the difference between the number of strokes they took and the par score for the course. (In golf, "par" for the course is the number of strokes an expert golfer is expected to need to complete all the holes on a golf course.) So a score of -5 means they took 5 fewer shots than par while a score of 2 means they took 2 more shots than par. Lower values are better. The two variables recorded were: Round1: The players score for the first round of the tournament. Final: The players final score for the tournament (i.e., the total score for the four rounds). Assume that linear regression analysis is valid for this data. Plot of Round 1 Score versus Final Score Final 25 20 Round 1 ** #0 **.* ** Round 1 Plot of Round 1 Score versus Final Score Final 25 20 B Std. Error 10 -40 -15 Summary output for fitting a linear regression model to the data Unstandardized Standardized Coefficients Coefficients 95% Confidence interval for 6 Model n Beta Lower Bound Upper Bound t Sig 2.682 0.010 3 2.278 0.849 0.570 (Constant) Round! 1018 0324 0413 3.144 0.003 0.367 1.500 a. Dependent Variable: Final (a) The equation of the least squares regression line for this analysis is (b) Under this regression analysis, we estimate that, on average, players who scored -2 on round 1 would get a final score (to two decimal places) of Select 1.018 0.324 0.413 3.144 0.003 0.367 1.669 a. Dependent Variable: Final (a) The equation of the least squares regression line for this analysis is: 1 Select] (b) Under this regression analysis, we estimate that, on average, players who scored -2 on round 1 would get a final score (to two decimal places) of [ Select] (c) For two players whose first round scores differ by 4, the regression analysis predicts that, on average, their final scores will differ (to two decimal places) by Select J (d) One player scored -3 in round 1 and then went on to get a final score of 1. Under this regression analysis, the residual is approximately Select] (e) Which one of the following is a correct interpretation of the P-value of 0.003 in the row for Round1 in the output above? Statement: Select (0) Which one of the following is NOT a correct interpretation of the confidence intervals in the table above? With 95% confidence, we estimate that I Select) Std. Error Model t Sig. Upper Bound 1 (Constant) 2.278 0.849 2.682 0.010 0.570 3.986 Round1 1.018 0.324 0.413 3.144 0.003 0.367 1.669 a. Dependent Variable: Final (a) The equation of the least squares regression line for this analysis is: [Select] Predicted Final = 1.018 x Round1 Average Final = 1.018 + 0.324 x Round1 Round1 = 2.278 + 1.018 x Predicted Final Predicted Final = 2.278 + 1.018 x Round1 Final = 2.278 + 1.018 x Predicted Round1 nate that, on average, players who scored -2 on round 1 ices) of [Select] (c) For two players whose first round scores differ by 4, the regression analysis predicts that, on average, their final scores will differ (to two decimal places) by [Select] (d) One player scored -3 in round 1 and then went on to get a final score of 1. Under this regression analysis, the residual is approximately [Select] (e) Which one of the following is a correct interpretation of the P-value of 0.003 in the row for Round1 in the output above? Statement: [Select] (f) Which one of the following is NOT a correct interpretation of the confidence intervals in the table above? With 95% confidence, we estimate that [Select] Beta Lower Bound Model B t Sig. Lower Bound Upper Bound 1 (Constant) 2.278 0.849 2.682 0.010 0.570 3.986 Round1 1.018 0.324 0.413 3.144 0.003 0.367 1.669 a. Dependent Variable: Final (a) The equation of the least squares regression line for this analysis is: [Select] # (b) Under this regression analysis, we estimate that. on average. plavers who scored -2 on round 1 [Sele would get a final score (to two decimal places) ( 1.45 -2.04 predicts that, on 0.24 (c) For two players whose first round scores diff average, their final scores will differ (to two dec 0.37 -3.54 (d) One player scored -3 in round 1 and then went on to get a final score of 1. Under this regression analysis, the residual is approximately [Select] (e) Which one of the following is a correct interpretation of the P-value of 0.003 in the row for Round1 in the output above? Statement: [Select] (f) Which one of the following is NOT a correct interpretation of the confidence intervals in the table above? With 95% confidence, we estimate that [Select] Error Beta Std. Error Model 8 t Sig. Lower Bound Upper Bound 1 (Constant) 2.278 0.849 2.682 0.010 0.570 3.986 Round1 1.018 0.324 0.413 3.144 0.003 0.367 1.669 a. Dependent Variable: Final (a) The equation of the least squares regression line for this analysis is: [Select] (b) Under this regression analysis, we estimate that, on average, players who scored -2 on round 1 would get a final score (to two decimal places) of [Select] (c) For two players whose first round scores differ by 4, the regression analysis predicts that, on average, their final scores will differ (to two decima aces) b [Select] 3.40 1.65 6.35 (d) One player scored -3 in round 1 and then went on to get regression analysis, the residual is approximately [Select] 9.11 4.07 (e) Which one of the following is a correct interpretation of the P-value of 0.003 in the row for Round1 in the output above? Statement: [Select] (f) Which one of the following is NOT a correct interpretation of the confidence intervals in the table above? : With 95% confidence, we estimate that [Select] Beta Std. Error B 2.278 1.018 Model t Sig. Lower Bound Upper Bound 1 (Constant) 0.849 2.682 0.010 0.570 3.986 Round1 0.324 0.413 3.144 0.003 0.367 1.669 a. Dependent Variable: Final (a) The equation of the least squares regression line for this analysis is: [Select] (b) Under this regression analysis, we estimate that, on average, players who scored -2 on round 1 would get a final score (to two decimal places) of [Select] (c) For two players whose first round score differ by 4, the regression analysis predicts that, on average, their final scores will differ (to two decimal places) by [Select] (d) One player scored -3 in round 1 and then went on to get a final score of 1. Under this regression analysis, the residual is approximatel [Select] 4.0 -1.8 3 in the row for (e) Which one of the following is a correct inter Round1 in the output above? 1.8 -4.0 -0.8 Statement: [Select] (f) Which one of the following is NOT a correct interpretation of the confidence intervals in the table above? # With 95% confidence, we estimate that [Select] Beta Std. Error B 2.278 1.018 Model t Sig Lower Bound Upper Bound 1 (Constant) 0.849 2.682 0.010 0.570 3.986 Round1 0.324 0413 3.144 0.003 0.367 1.669 a. Dependent Variable: Final (a) The equation of the least squares regression line for this analysis is: [Select] (b) Under this regression analysis, we estimate that, on average, players who scored -2 on round 1 would get a final score (to two decimal places) of [Select] (c) For two players whose first round scores differ by 4, the regression analysis predicts that, on average, their final scores will differ (to two decimal places) by [Select] 0 (d) One player scored-3 in round 1 and then went on to get a final score of 1. Under this regression analysis, the residual is approximately [Select] (e) Which one of the following is correct interpretation of the P-value of 0.003 in the row for Round 1 in the output above? [Select] Statemen There is strong evidence that players with different round 1 scores would be expected to have different final round scores, on There is no evidence of a linear relationship between Round1 and Final. (f) Which table abo We have strong evidence that the slope of the true line is zero. At the 5% level of significance, we may not claim there is a linear association between Round and Final At the 5% level of significance, we may not claim there is a linear relationship between Round1 and Final. With 95% conmuence, we estimate una Beta Model B t Sig Lower Bound Upper Bound 1 0.849 2.682 0.010 0.570 3.986 (Constant) 2.278 Round1 1.018 0.324 0.413 3.144 0.003 0.367 1.669 a. Dependent Variable: Final (a) The equation of the least squares regression line for this analysis is: [Select] (b) Under this regression analysis, we estimate that, on average, players who scored -2 on round 1 would get a final score (to two decimal places) of [Select] (c) For two players whose first round scores differ by 4, the regression analysis predicts that, on average, their final scores will differ (to two decimal places) by [Select] (d) One player scored -3 in round 1 and then went on to get a final score of 1. Under this regression analysis, the residual is approximately [Select] # (e) Which one of the following is a correct interpretation of the P-value of 0.003 in the row for Round1 in the output above? # Statement: [Select] (f) Which one of the following is NOT a cort interpretation of the confidence intervals in the table above? [Select] With 95% confidence, we est the y-intercept of the true regression line is between 0.570 and 3.986. for each stroke lower scored in round 1 of the tournament, the average final score is between 0.37 and 1.67 lower. each additional two strokes scored in round 1 of the tournament are associated with an average final score being between 0.73 players who score 0 on round 1 will have an average final score between 0.57 and 3.99 each additional stroke scored in round 1 of the tournament is associated with an average final score being between 1.30 higher Error Beta Model B t Sig Lower Bound Upper Bound 1 2.278 0.849 2.682 0.010 0.570 3.986 (Constant) Round1 1.018 0.324 0.413 3.144 0.003 0.367 1.669 a. Dependent Variable: Final (a) The equation of the least squares regression line for this analysis is: [Select] (b) Under this regression analysis, we estimate that, on average, players who scored -2 on round 1 would get a final score (to two decimal places) of [Select] (c) For two players whose first round scores differ by 4, the regression analysis predicts that, on average, their final scores will differ (to two decimal places) by [Select] (d) One player scored -3 in round 1 and then went on to get a final score of 1. Under this regression analysis, the residual is approximately [Select] : (e) Which one of the following is a correct interpretation of the P-value of 0.003 in the row for Round1 in the output above? # Statement: [Select] (f) Which one of the following is NOT a cort interpretation of the confidence intervals in the table above? [Select] With 95% confidence, we est the y-intercept of the true regression line is between 0.570 and 3.986. for each stroke lower scored in round 1 of the tournament, the average final score is between 0.37 and 1.67 lower each additional two strokes scored in round 1 of the tournament are associated with an average final score being between 0.73 players who score 0 on round 1 will have an average final score between 0.57 and 3.99 each additional stroke scored in round 1 of the tournament is associated with an average final score being between 1.30 higher Error Beta
Step by Step Solution
There are 3 Steps involved in it

Get step-by-step solutions from verified subject matter experts