

Question: Make the financial ratios analysis of MyDeco Corporation Financial Statements & Stock Price: MyDeco Corp. (66.7) (All data as of fiscal year end; in $
Make the financial ratios analysis of MyDeco Corporation 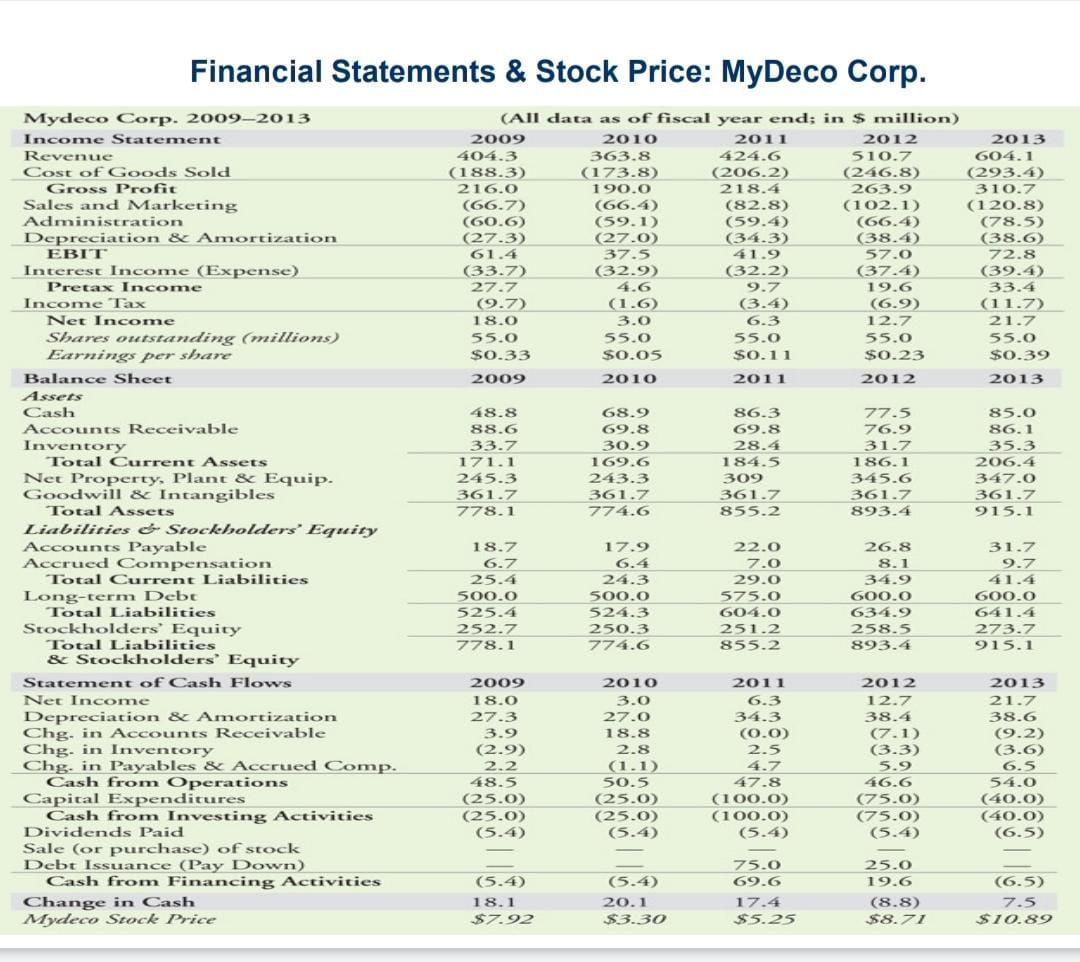
Financial Statements & Stock Price: MyDeco Corp. (66.7) (All data as of fiscal year end; in $ million) 2009 2010 2011 2012 2013 404.3 363.8 424.6 510.7 604.1 (188.3) (173.8) (206.2) (246.8) (293.4) 216.0 190.0 218.4 263.9 310.7 (66.4) (82.8) (102.1) (120.8) (60.6) (9.1) (59.4) (66.4) (78.5) (27.3) 22 (27.0) 19 (34.3) (38.4) (38.6) 61.4 37.5 41.9 57.0 72.8 (37.4) (39.4) 27.7 4.6 33.4 (9.7) (1.6) (3.4) (6.9) (11.7 18.0 3.0 6.3 12.7 21.7 55.0 55.0 55.0 55.0 55.0 $0.33 $0.05 $0.11 $0.23 $0.39 2009 2010 2011 2012 2013 (33.7) (32.9) (32.2 9.7 19.6 48.8 88.6 33.7 171.1 245.3 361.7 778.1 68.9 69.8 30.9 169.6 243.3 361.7 774.6 86.3 69.8 28.4 184.5 309 361.7 855.2 Mydeco Corp. 2009-2013 Income Statement Revenue Cost of Goods Sold Gross Profit Sales and Marketing Administration Depreciation & Amortization EBIT Interest Income (Expense) Pretax Income Income Tax Net Income Shares outstanding (millions) Earnings per share Balance Sheet Assets Cash Accounts Receivable Inventory Total Current Assets Net Property, Plant & Equip. Goodwill & Intangibles Total Assets Liabilities & Stockholders' Equity Accounts Payable Accrued Compensation Total Current Liabilities Long-term Debt Total Liabilities Stockholders' Equity Total Liabilities & Stockholders' Equity Statement of Cash Flows Net Income Depreciation & Amortization Chg, in Accounts Receivable Chg in Inventory Chg. in Payables & Accrued Comp. Cash from Operations Capital Expenditures Cash from Investing Activities Dividends Paid Sale (or purchase) of stock Debt Issuance (Pay Down) Cash from Financing Activities Change in Cash Mydeco Stock Price 77.5 76.9 31.7 186.1 345.6 361.7 893.4 85.0 86.1 35.3 206.4 347.0 361.7 915.1 18.7 22.0 6.7 7.0 25.4 500.0 525.4 252.7 778.1 17.9 6.4 24.3 500.0 524.3 250.3 774.6 29.0 575.0 604.0 251.2 855.2 26.8 8.1 34.9 600.0 634.9 258.5 893.4 31.7 9.7 41.4 600.0 641.4 273.7 915.1 2009 18.0 27.3 3.9 (2.9) 2011 6.3 34.3 (0.0) 2.5 4.7 2010 3.0 27.0 18.8 2.8 (1.1) 50.5 (25.0) (25.0) (5.4) 2012 12.7 38.4 (7.1) (3.3) 5.9 2013 21.7 38.6 (9.2) (3.6) 2.2 6.5 47.8 46.6 48.5 (25.0) (25.0) (5.4) (100.0) (100.0) (5.4) (75.0) (75.0) (5.4) 54.0 (40.0) (40.0) (6.5) (5.4) 18.1 $7.92 (5.4) 20.1 $3.30 75.0 69.6 17.4 $5.25 25.0 19.6 (8.8) $8.71 (6.5) 7.5 $10.89
Step by Step Solution
There are 3 Steps involved in it

Get step-by-step solutions from verified subject matter experts