

Question: Make the following changes to the plot using R Thank you . (a). Include fill, color, and alpha in ggolot to fill the bars with
Make the following changes to the plot using R
Thank you
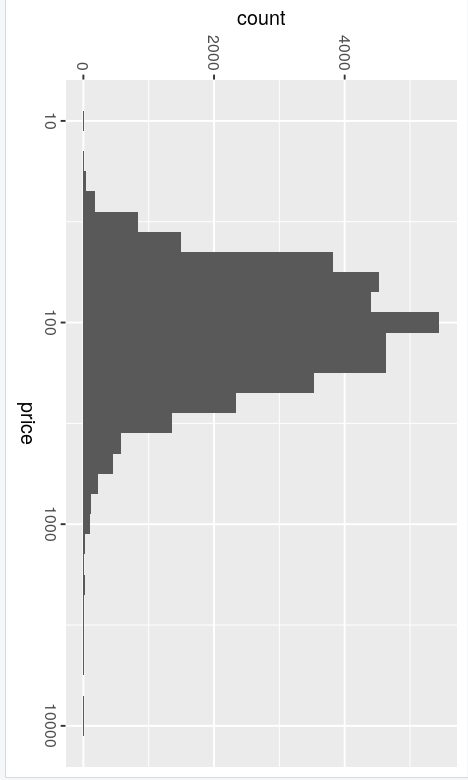
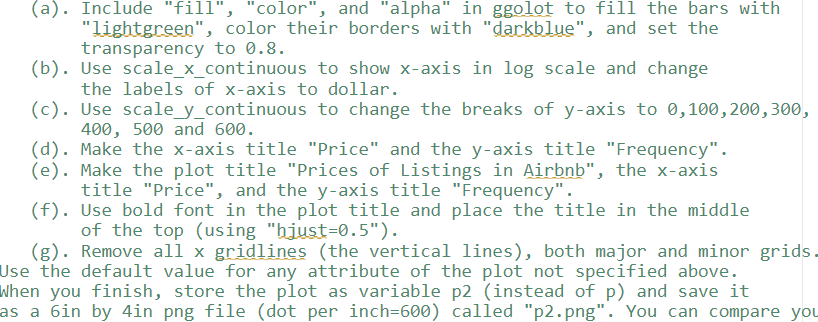
. (a). Include "fill", "color", and "alpha" in ggolot to fill the bars with "lightgreen", color their borders with "darkblue", and set the transparency to 0.8. (b). Use scale_x_continuous to show x-axis in log scale and change the labels of x-axis to dollar. (c). Use scale_y_continuous to change the breaks of y-axis to 0,100,200,300, 400,500 and 600. (d). Make the x-axis title "Price" and the y-axis title "Frequency". (e). Make the plot title "Prices of Listings in Airbnb", the x-axis title "Price", and the y-axis title "Frequency". (f). Use bold font in the plot title and place the title in the middle of the top (using "bjust=0.5"). (g). Remove all x gridlines (the vertical lines), both major and minor grids Jse the default value for any attribute of the plot not specified above. When you finish, store the plot as variable p2 (instead of p) and save it as a 6 in by 4 in png file (dot per inch=600) called "p2.png". You can compare you . (a). Include "fill", "color", and "alpha" in ggolot to fill the bars with "lightgreen", color their borders with "darkblue", and set the transparency to 0.8. (b). Use scale_x_continuous to show x-axis in log scale and change the labels of x-axis to dollar. (c). Use scale_y_continuous to change the breaks of y-axis to 0,100,200,300, 400,500 and 600. (d). Make the x-axis title "Price" and the y-axis title "Frequency". (e). Make the plot title "Prices of Listings in Airbnb", the x-axis title "Price", and the y-axis title "Frequency". (f). Use bold font in the plot title and place the title in the middle of the top (using "bjust=0.5"). (g). Remove all x gridlines (the vertical lines), both major and minor grids Jse the default value for any attribute of the plot not specified above. When you finish, store the plot as variable p2 (instead of p) and save it as a 6 in by 4 in png file (dot per inch=600) called "p2.png". You can compare you
Step by Step Solution
There are 3 Steps involved in it

Get step-by-step solutions from verified subject matter experts