

Question: Make the following plots in PYTHON 3, a fter reading the data into lists (using the CSV module) time series of each group as
Make the following plots in PYTHON 3, after reading the data into lists (using the CSV module)
- time series of each group as a line chart
- time series of each group as a bar chart
- time series of these groups as a stack chart
- a pie chart for the distribution in 2015
Plotting chart in Python 3.
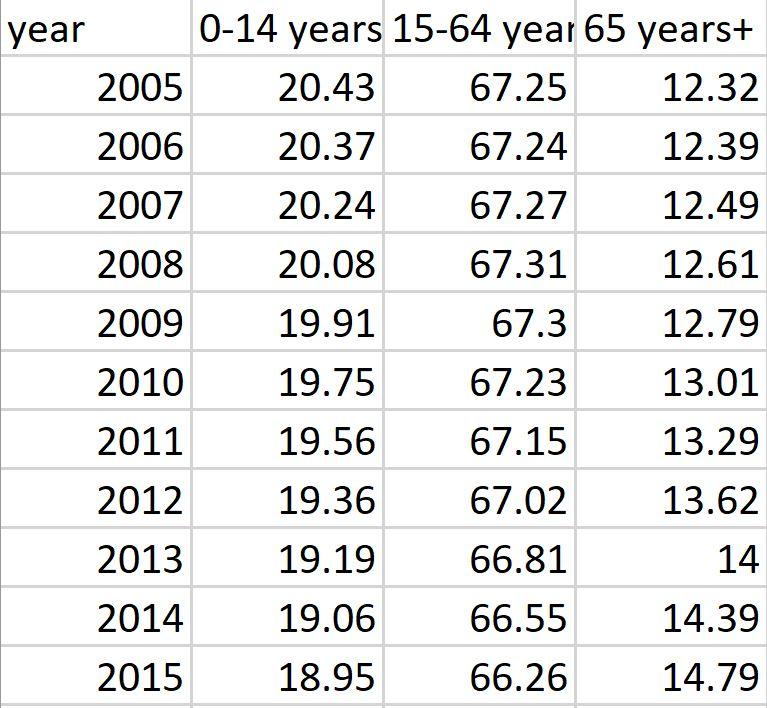
year 2005 2006 2007 2008 2009 2010 2011 2012 2013 2014 2015 0-14 years 15-64 year 65 years+ 20.43 67.25 12.32 20.37 67.24 12.39 20.24 67.27 12.49 20.08 67.31 12.61 19.91 67.3 12.79 19.75 67.23 13.01 19.56 67.15 13.29 19.36 67.02 13.62 19.19 66.81 14 19.06 66.55 14.39 18.95 66.26 14.79
Step by Step Solution
3.53 Rating (153 Votes )
There are 3 Steps involved in it
Here is the code of This question in Python import matplotlibpyplot as plt Data years 2005 2006 2007 ... View full answer

Get step-by-step solutions from verified subject matter experts