

Question: Make your own data table modeled after group 6 's table but including all the data collected and/or calculated by all 6 groups. This includes
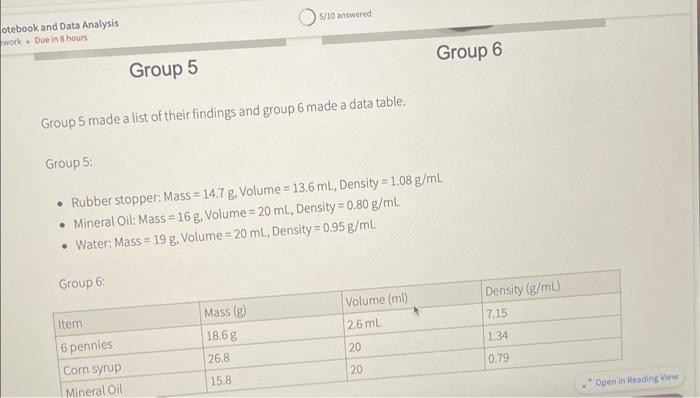
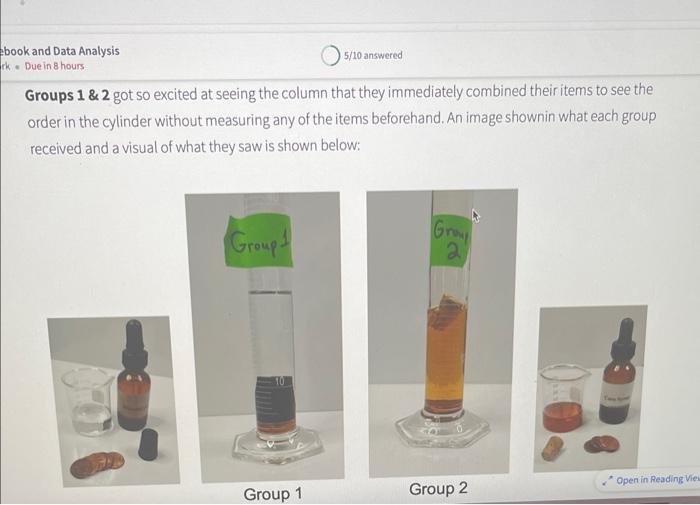
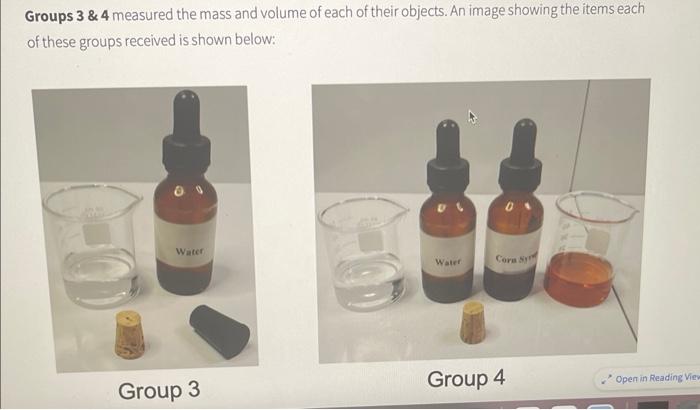
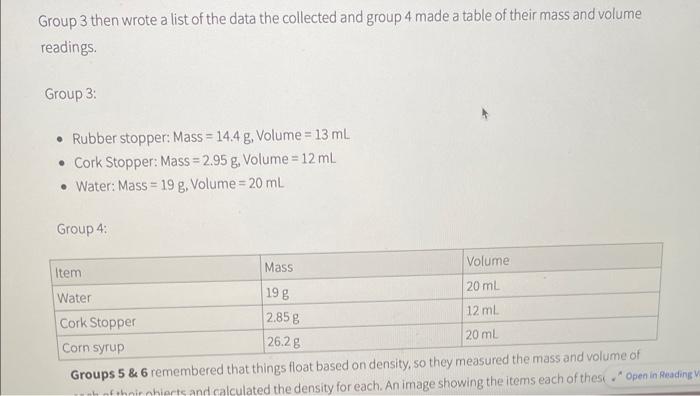
Make your own data table modeled after group 6 's table but including all the data collected and/or calculated by all 6 groups. This includes mass, volume and density. If a group does not have any data for a given column use a dash. or write N/A. If a group did not calculate the density for a given itern you should do the calculation for them. The attached file shows you an example that includes all the column and rows titles for this table You car either copy this format or make your own. You can make a table on your computer or by hand in your notebook. Once your table is ready upload an image file (PDF, JPEG, PNG) here. Group 5 made a list of their findings and group 6 made a data table. Group 5: - Rubber stopper. Mass =14.7g, Volume =13.6mL, Density =1.08g/mL - Mineral Oil: Mass =16g, Volume =20mL, Density =0.80g/mL - Water: Mass =19g, Volume =20mL, Density =0.95g/mL Groups 1&2 got so excited at seeing the column that they immediately combined their items to see the order in the cylinder without measuring any of the items beforehand. An image shownin what each group received and a visual of what they saw is shown below: Groups 3&4 measured the mass and volume of each of their objects. An image showing the items each of these groups received is shown below: Group 3 Group 3 then wrote a list of the data the collected and group 4 made a table of their mass and volume readings. Group 3: - Rubber stopper: Mass =14.4g, Volume =13mL - Cork Stopper: Mass =2.95g, Volume =12mL - Water: Mass =19g, Volume =20mL Group 4: Make your own data table modeled after group 6 's table but including all the data collected and/or calculated by all 6 groups. This includes mass, volume and density. If a group does not have any data for a given column use a dash. or write N/A. If a group did not calculate the density for a given itern you should do the calculation for them. The attached file shows you an example that includes all the column and rows titles for this table You car either copy this format or make your own. You can make a table on your computer or by hand in your notebook. Once your table is ready upload an image file (PDF, JPEG, PNG) here. Group 5 made a list of their findings and group 6 made a data table. Group 5: - Rubber stopper. Mass =14.7g, Volume =13.6mL, Density =1.08g/mL - Mineral Oil: Mass =16g, Volume =20mL, Density =0.80g/mL - Water: Mass =19g, Volume =20mL, Density =0.95g/mL Groups 1&2 got so excited at seeing the column that they immediately combined their items to see the order in the cylinder without measuring any of the items beforehand. An image shownin what each group received and a visual of what they saw is shown below: Groups 3&4 measured the mass and volume of each of their objects. An image showing the items each of these groups received is shown below: Group 3 Group 3 then wrote a list of the data the collected and group 4 made a table of their mass and volume readings. Group 3: - Rubber stopper: Mass =14.4g, Volume =13mL - Cork Stopper: Mass =2.95g, Volume =12mL - Water: Mass =19g, Volume =20mL Group 4
Step by Step Solution
There are 3 Steps involved in it

Get step-by-step solutions from verified subject matter experts