

Question: Management has provided you the inventory listing in excel. Column C shows the historical cost, and column E is the last selling price of the
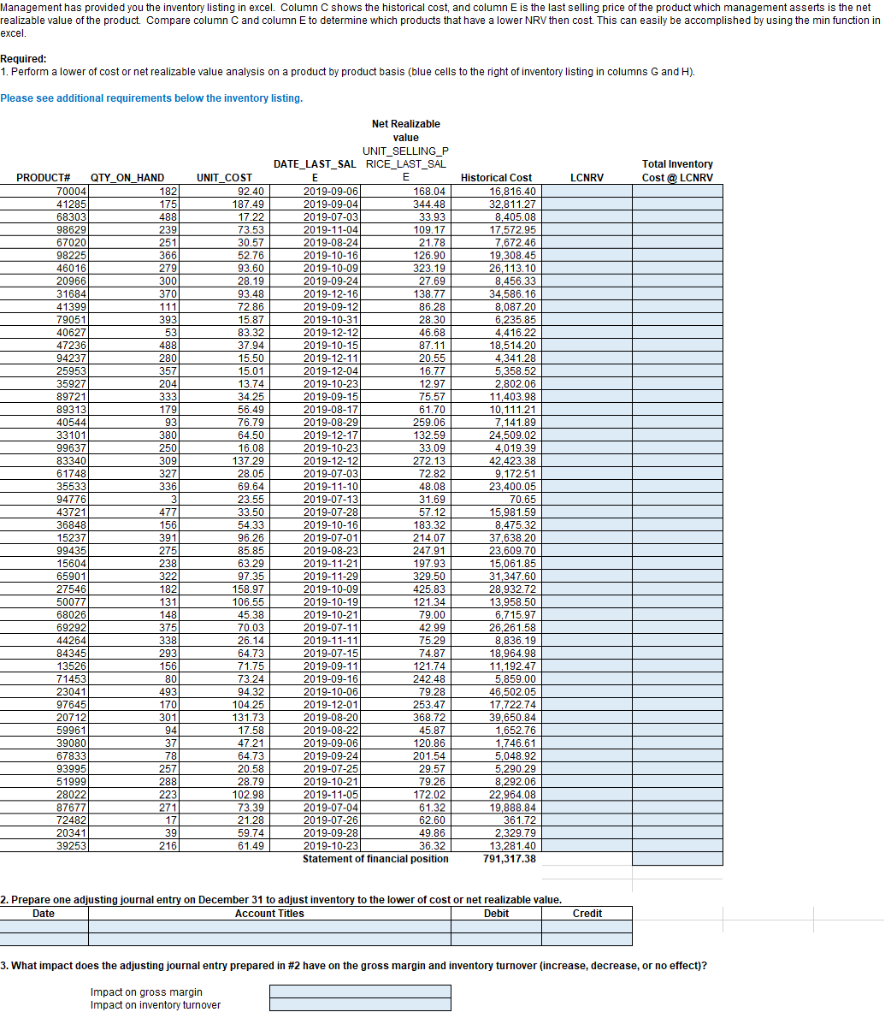
Management has provided you the inventory listing in excel. Column C shows the historical cost, and column E is the last selling price of the product which management asserts is the net realizable value of the product Compare column C and column E to determine which products that have a lower NRV then cost. This can easily be accomplished by using the min function in excel. Required: 1. Perform a lower of cost or net realizable value analysis on a product by product basis (blue cells to the right of inventory listing in columns G and H). Please see additional requirements below the inventory listing. Total Inventory Cost @ LCNRV LCNRV 4881 Net Realizable value UNIT SELLING P DATE_LAST_SAL RICE_LAST_SAL UNIT COST 92.40 2 019-09-06 168.04 187.49 2019-09- 04 3 44.48 17 221 2019-07-03 33.93 73 53 2019-11-04 109.17 30 57 2019-08-24 21.78 52.76 2014-10-16 126.90 93.60 2019-10-09 323.19 28.19 2019-09-24 27.69 93.48 2019-12-16 138.77 72.86 2019-09-12 86.28 15.87 2019-10-31 28.30 83.32 2019-12-12 46.68 37.94 2019-10-15 87.11 | 15.50 2019-12-11 20.55 15.01 2019-12-04) 16.77 13.74 | 2019-10-23_ 12.97 34 25 2019-09-15 75.57 56.49 2019-08-17 61.70 76.79 2019-08-29 259.06 64.50 2019-12-17 132.59 16.08 2019-10-23 33.09 137 29 2019-12-12 272.13 2805 2019-07-03 7282 69.64 2019-11-10 48.08 23.55 2019-07-13 31.69 33.50 2019-07-281 57.12 5433 2019-10-16 183 32 96 261 2019-07-01 214.07 85.85 2019-08-23 247.91 63.29 2019-11-21 197.93 97.35 2019-11-29 329.50 158.97 2019-10-09 425.83 106 55 2019-10-19 121 34 45.38 2019-10-21 79.00 70.03 2019-07-11 42.99 26.14 2019-11-11 75.29 64.73 2019-07-15 10.07. 15 7 4.87 71.75 2019-09-11 121.74 73 24 2019-09-16 242.48 94.32 2019-10-06 79.28 104 25 2019-12-01 253,47 131.73 2019-08-20 368.72 1758 2019-08-22 45.87 47.21 2019-09-06 120.86 64.73 2019-09-24 201.54 20 58 2019-07-25 29.57 28.79 2019-10-21 79.26 102.98 2019-11-05 172.02 73.39 2019-07-04 61.32 21.28 2019-07- 26 6 2.60 59.74 2019-09-28 49.86 61.49 2019-10-23 36.32 Statement of financial position PRODUCT# QTY ON HAND 70004 1 82 41285 175 68303 98629 2391 67020 251 98225 366 46016 2791 209661 300 31684 3701 41399 111 79051 393) 40627 531 47236 4881 94237| 280 25953 3571 35927 204 89721 3331 89313 1791 405441 93 33101 380 99637 250 83340 309 61748 327 35533 336 94776 437211 4771_ 36848 156) 15237 391 994351 275 15604 238 65901 3221 275461 1A21 50077 1311 68026 1481 69292 375 44264 338 84345 2931 13526 714531 80 23041 4931 97645 1701 20712 301 59961 94 39080 371 67833 93995 257 51999) 288 28022 2231 87677 271 724821 171 203411 391 39253 216 31 Historical Cost 16,816.40 32,811.27 8,405.08 17,572.95 7,672.46 19,308.45 26 113.10 8,456.33 34,586.16 8,087 20 6,235.85 4,416.22 18,514.20 4.341.28 5,358.52 2,802.06 11,403.98 10,111.21 7,141.89 24,509.02 4,019.39 42,423.38 9,172 511 23,400.05 70.65 15,981.59 8,475.32 37,638 20 23,609.70 15,061.85 31,347.60 28,932.72 13.958.50 | 6.715.97 26,261.58 8,836.19 18.964 99 11,192.47 5,859.00 46,50205 17,722.74 | 39,650.84 1,652.76 1.746.61 5,048.92 5,290 29 8,29206 22,964.08 19,888.84 361.72 2.329.79 13,281.40 791,317.38 156 2. Prepare one adjusting journal entry on December 31 to adjust inventory to the lower of cost or net realizable value. Date Account Titles Debit Credit 3. What impact does the adjusting journal entry prepared in #2 have on the gross margin and inventory turnover (increase, decrease, or no effect)? Impact on gross margin Impact on inventory turnover Management has provided you the inventory listing in excel. Column C shows the historical cost, and column E is the last selling price of the product which management asserts is the net realizable value of the product Compare column C and column E to determine which products that have a lower NRV then cost. This can easily be accomplished by using the min function in excel. Required: 1. Perform a lower of cost or net realizable value analysis on a product by product basis (blue cells to the right of inventory listing in columns G and H). Please see additional requirements below the inventory listing. Total Inventory Cost @ LCNRV LCNRV 4881 Net Realizable value UNIT SELLING P DATE_LAST_SAL RICE_LAST_SAL UNIT COST 92.40 2 019-09-06 168.04 187.49 2019-09- 04 3 44.48 17 221 2019-07-03 33.93 73 53 2019-11-04 109.17 30 57 2019-08-24 21.78 52.76 2014-10-16 126.90 93.60 2019-10-09 323.19 28.19 2019-09-24 27.69 93.48 2019-12-16 138.77 72.86 2019-09-12 86.28 15.87 2019-10-31 28.30 83.32 2019-12-12 46.68 37.94 2019-10-15 87.11 | 15.50 2019-12-11 20.55 15.01 2019-12-04) 16.77 13.74 | 2019-10-23_ 12.97 34 25 2019-09-15 75.57 56.49 2019-08-17 61.70 76.79 2019-08-29 259.06 64.50 2019-12-17 132.59 16.08 2019-10-23 33.09 137 29 2019-12-12 272.13 2805 2019-07-03 7282 69.64 2019-11-10 48.08 23.55 2019-07-13 31.69 33.50 2019-07-281 57.12 5433 2019-10-16 183 32 96 261 2019-07-01 214.07 85.85 2019-08-23 247.91 63.29 2019-11-21 197.93 97.35 2019-11-29 329.50 158.97 2019-10-09 425.83 106 55 2019-10-19 121 34 45.38 2019-10-21 79.00 70.03 2019-07-11 42.99 26.14 2019-11-11 75.29 64.73 2019-07-15 10.07. 15 7 4.87 71.75 2019-09-11 121.74 73 24 2019-09-16 242.48 94.32 2019-10-06 79.28 104 25 2019-12-01 253,47 131.73 2019-08-20 368.72 1758 2019-08-22 45.87 47.21 2019-09-06 120.86 64.73 2019-09-24 201.54 20 58 2019-07-25 29.57 28.79 2019-10-21 79.26 102.98 2019-11-05 172.02 73.39 2019-07-04 61.32 21.28 2019-07- 26 6 2.60 59.74 2019-09-28 49.86 61.49 2019-10-23 36.32 Statement of financial position PRODUCT# QTY ON HAND 70004 1 82 41285 175 68303 98629 2391 67020 251 98225 366 46016 2791 209661 300 31684 3701 41399 111 79051 393) 40627 531 47236 4881 94237| 280 25953 3571 35927 204 89721 3331 89313 1791 405441 93 33101 380 99637 250 83340 309 61748 327 35533 336 94776 437211 4771_ 36848 156) 15237 391 994351 275 15604 238 65901 3221 275461 1A21 50077 1311 68026 1481 69292 375 44264 338 84345 2931 13526 714531 80 23041 4931 97645 1701 20712 301 59961 94 39080 371 67833 93995 257 51999) 288 28022 2231 87677 271 724821 171 203411 391 39253 216 31 Historical Cost 16,816.40 32,811.27 8,405.08 17,572.95 7,672.46 19,308.45 26 113.10 8,456.33 34,586.16 8,087 20 6,235.85 4,416.22 18,514.20 4.341.28 5,358.52 2,802.06 11,403.98 10,111.21 7,141.89 24,509.02 4,019.39 42,423.38 9,172 511 23,400.05 70.65 15,981.59 8,475.32 37,638 20 23,609.70 15,061.85 31,347.60 28,932.72 13.958.50 | 6.715.97 26,261.58 8,836.19 18.964 99 11,192.47 5,859.00 46,50205 17,722.74 | 39,650.84 1,652.76 1.746.61 5,048.92 5,290 29 8,29206 22,964.08 19,888.84 361.72 2.329.79 13,281.40 791,317.38 156 2. Prepare one adjusting journal entry on December 31 to adjust inventory to the lower of cost or net realizable value. Date Account Titles Debit Credit 3. What impact does the adjusting journal entry prepared in #2 have on the gross margin and inventory turnover (increase, decrease, or no effect)? Impact on gross margin Impact on inventory turnover
Step by Step Solution
There are 3 Steps involved in it

Get step-by-step solutions from verified subject matter experts