

Question: manager accounting Tableau Dashboard Activity: Interpret and Communicate 4.1 (Static) [Exercise 4.5; L.O.5] Piedmont Company segments its business into two regions - Nonth and South.
![L.O.5] Piedmont Company segments its business into two regions - Nonth and](https://dsd5zvtm8ll6.cloudfront.net/si.experts.images/questions/2024/10/6717cee0b0ca4_5366717cee02c254.jpg)
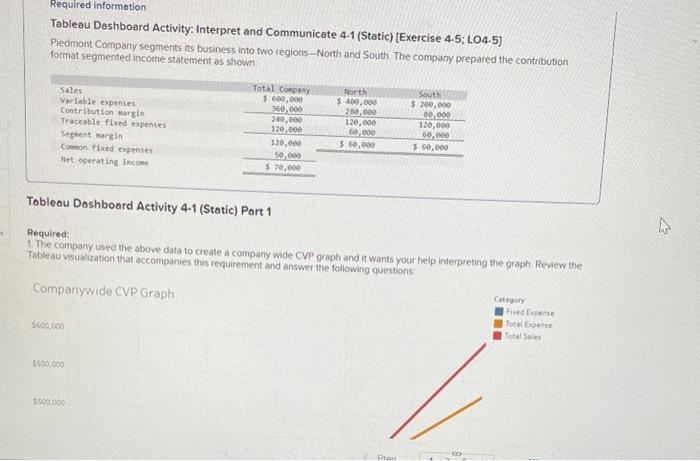
Tableau Dashboard Activity: Interpret and Communicate 4.1 (Static) [Exercise 4.5; L.O.5] Piedmont Company segments its business into two regions - Nonth and South. The company prepared the contribution format segmented income statement as shown Tobleou Dashboard Activity 41 (Static) Part 1 Required: 1. The company used the above data to create a company wide CVP graph and a wants your help interpreting the graph Review the Tablesu visualization that accompanies this requirement and answer the following questions. Companywide CVP Graph $600.000 5550,000 5500000 a. The company's total fixed expense is: $50,000 $120,000 $170,000 $70.000 b. The company's overall break-even point in dollar sales iss. $68,000$425,000$368.000$525,000 c. The company's overall proft when sales are $500.000 is: $30,000$50,000$5,000$125,000 Hint The proft is determined by quantifying the gap between the total sales and totar expencelines at a sales lever or $500,000
Step by Step Solution
There are 3 Steps involved in it

Get step-by-step solutions from verified subject matter experts