

Question: managerial accounting MAP One makes maple syrup in Canada. In 2019 it made 220,000 400gr bottle of syrups and sold 190,000 of them, at an
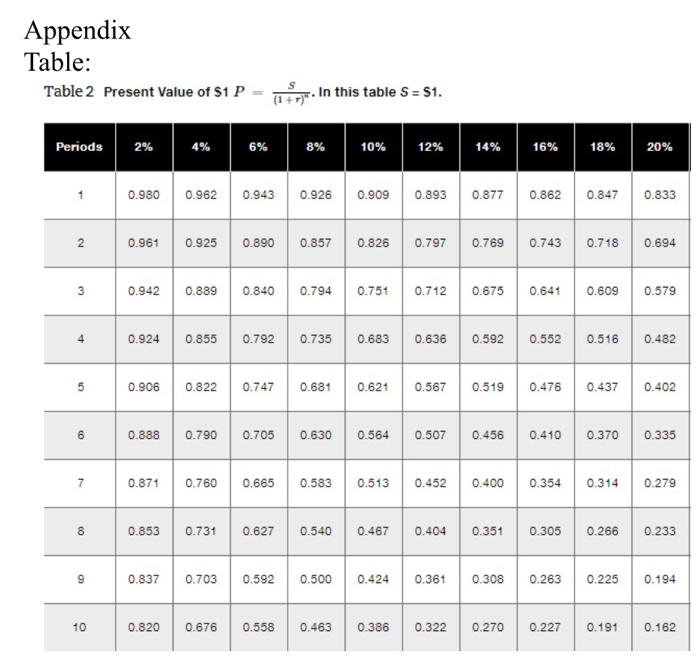
Appendix Table: Table 2 Present Value of $1 P In this table S = $1. Periods 2% 4% 6% 8% 10% 12% 14% 16% 18% 20% 0.980 0.962 0.943 0.926 0.909 0.893 0.877 0.862 0.847 0.833 2 2 0.961 0.925 0.890 0.857 0.826 0.797 0.769 0.743 0.718 0.694 3 3 0.942 0.889 0.840 0.794 0.751 0.712 0.675 0.641 0.609 0.579 0.924 0.855 0.792 0.735 0.683 0.636 0.592 0.552 0.516 0.482 5 0.906 0.822 0.747 0.681 0.621 0.567 0.519 0.476 0.437 0.402 CO 0.888 0.790 0.705 0.630 0.564 0.507 0.456 0.410 0.370 0.335 7 0.871 0.760 0.665 0.583 0.513 0.452 0.400 0.354 0.314 0.279 8 8 0.853 0.731 0.627 0.540 0.467 0.404 0.351 0.305 0.266 0.233 9 0.837 0.703 0.592 0.500 0.424 0.361 0.308 0.263 0.225 0.194 10 0.820 0.676 0.558 0.463 0.386 0.322 0.270 0.227 0.191 0.162
Step by Step Solution
There are 3 Steps involved in it

Get step-by-step solutions from verified subject matter experts